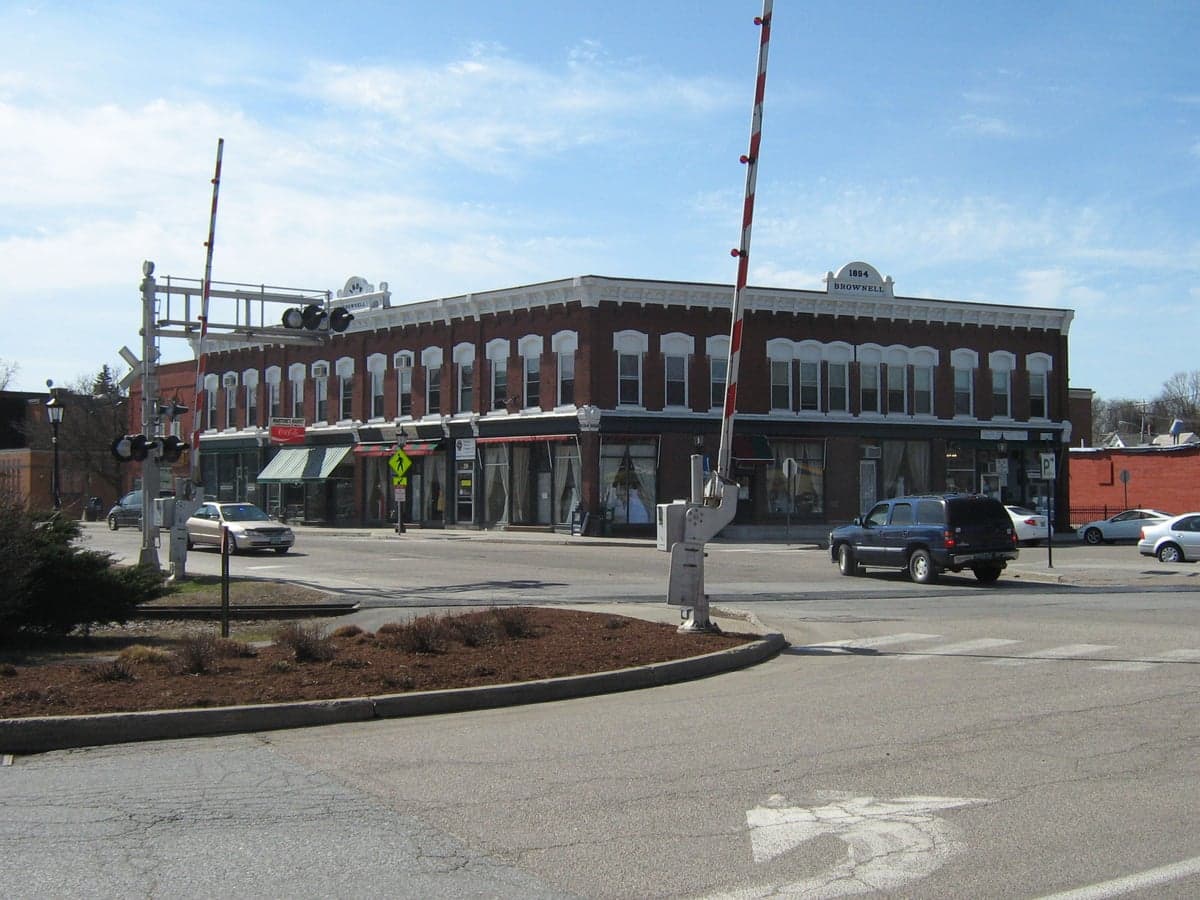
Photo: Wikipedia
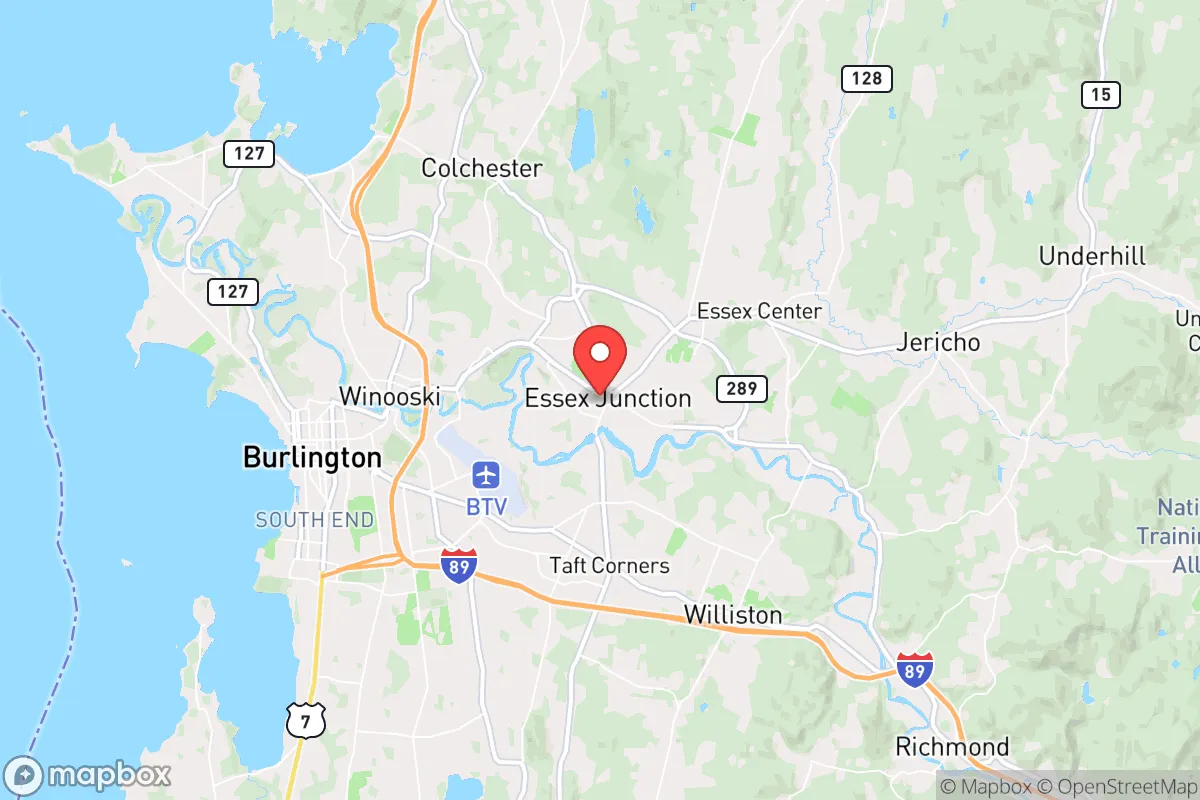
Demographics of Essex Junction, VT
Affluence Level in Essex Junction, VT
A middle-class area roughly in line with national averages across income, home values, education, and employment.
People of Essex Junction, VT
Essex Junction, Vermont, is a compact, family-oriented city of 10,720 residents that blends small-town New England character with a notable professional-class density. Its population is predominantly white (82.9%) but includes a distinct and growing Indian-subcontinent community (4.3%) and a smaller East/Southeast Asian presence (1.3%), giving it a more diverse demographic profile than most Vermont towns of similar size. With over half of adults holding a college degree (50.3%), the city leans educated and white-collar, shaped heavily by its proximity to the University of Vermont Medical Center and global tech employers like GlobalFoundries. The city’s identity is rooted in a history of industrial migration, suburban expansion, and recent professional immigration.
How the city was settled and grew
Essex Junction was originally a farming hamlet that transformed with the arrival of the Central Vermont Railroad in the 1840s, which made it a freight and passenger hub. The railroad drew Irish and French Canadian laborers who built the first dense neighborhoods near the tracks—the Railroad District (around today’s Lincoln Street and Railroad Avenue) became the working-class core, with modest homes and boarding houses for rail workers. By the late 19th century, the village’s machine shops and foundries attracted a second wave of French Canadians and a smaller number of Italian immigrants, who settled in the Old Village (the area around Maple Street and Park Street). These groups remained distinct through the early 1900s, with French Canadian families forming the backbone of St. Lawrence Parish. The city’s population stayed under 3,000 until after World War II, when the expansion of IBM’s Essex Junction facility (now GlobalFoundries) triggered a suburban boom. IBM engineers and managers—mostly white, native-born professionals—built homes in the Heights (the hilly area off Sand Hill Road and Mountain View Drive), creating a postwar bedroom community that doubled the village’s population between 1950 and 1970.
Modern era (post-1965)
The 1965 Hart-Cellar Act had little immediate effect on Essex Junction, but the city’s demographic shift began in earnest after 1990, driven by two forces: the expansion of GlobalFoundries (formerly IBM) and the growth of the University of Vermont Medical Center. GlobalFoundries recruited skilled engineers from India and, to a lesser extent, East Asia, who settled in the Susie Wilson Road corridor and newer subdivisions like the Maple Tree Place area, where townhouses and single-family homes offered proximity to the fab plant. This Indian-subcontinent community grew from negligible in 1990 to 4.3% of the population by 2020, making Essex Junction one of the few Vermont towns with a visible Indian professional class. Meanwhile, the medical center drew a smaller number of East/Southeast Asian professionals (1.3%), who tend to live in the same newer subdivisions or in apartments near the Five Corners district. The Black population (3.3%) and Hispanic population (1.7%) remain small and are dispersed across the city, with no single ethnic enclave. The white population (82.9%) is concentrated in the older neighborhoods—the Railroad District, Old Village, and the Heights—where generational families still dominate. The foreign-born share (6.1%) is nearly double the Vermont average, reflecting the city’s role as a tech and medical hub.
The future
Essex Junction’s population is likely to continue its slow, steady growth (projected 1–2% per decade) as GlobalFoundries and the medical center expand. The Indian-subcontinent community is the fastest-growing segment, driven by H-1B hires and family reunification, and is expected to reach 6–7% of the population by 2035. This group is highly educated and economically integrated, settling in the same newer subdivisions rather than forming a separate enclave, which suggests assimilation rather than tribalization. The East/Southeast Asian population is stable or slightly growing, while the Black and Hispanic shares are likely to remain small due to limited affordable housing and the city’s high cost of living. The white population is aging—many long-time residents in the Heights and Old Village are retirees—but younger white families continue to move in, drawn by the schools and safety. The city is not homogenizing; rather, it is becoming a two-tier professional town: a white, native-born majority in older neighborhoods and a smaller but visible Indian-subcontinent professional class in newer subdivisions. This creates a stable, low-tension demographic landscape, but one where economic class (college-educated professionals vs. service workers) is a sharper divide than ethnicity.
For a conservative-leaning mover, Essex Junction offers a rare combination: a safe, high-amenity small city with excellent schools and a strong tax base, where demographic change is gradual and driven by high-skilled immigration rather than rapid diversification. The city is becoming more professional and more educated, but its core character—quiet, family-focused, and rooted in Vermont’s Yankee and French Canadian heritage—remains intact. New arrivals, whether from within the U.S. or abroad, will find a place that values order, property values, and community stability above all else.
* Values derived from national, state, county, city and local statistics and may differ in a specific area. Last updated: 2026-04-24T12:16:37.000Z
Narrative content on this page is AI-generated and may contain mistakes. Verify any details that matter before acting on them.
ReloMaps may earn a commission from affiliate links at no extra cost to you.