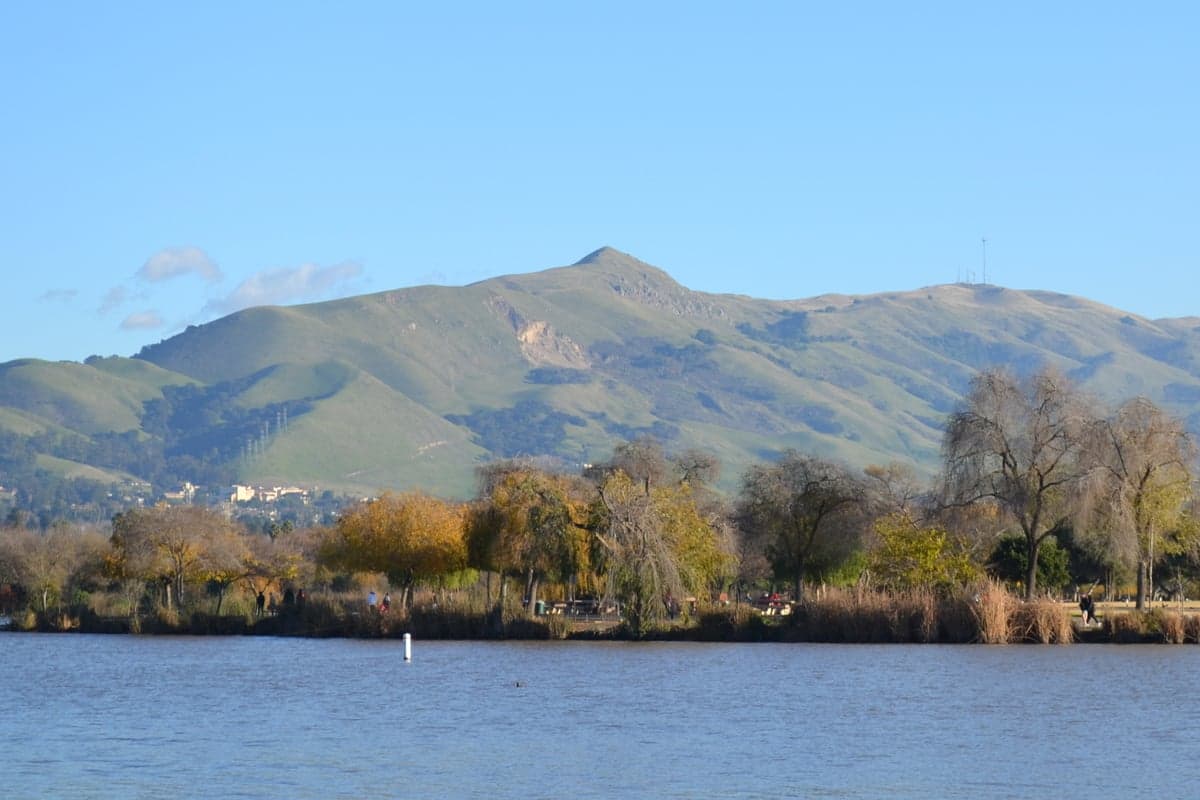
Photo: Wikipedia
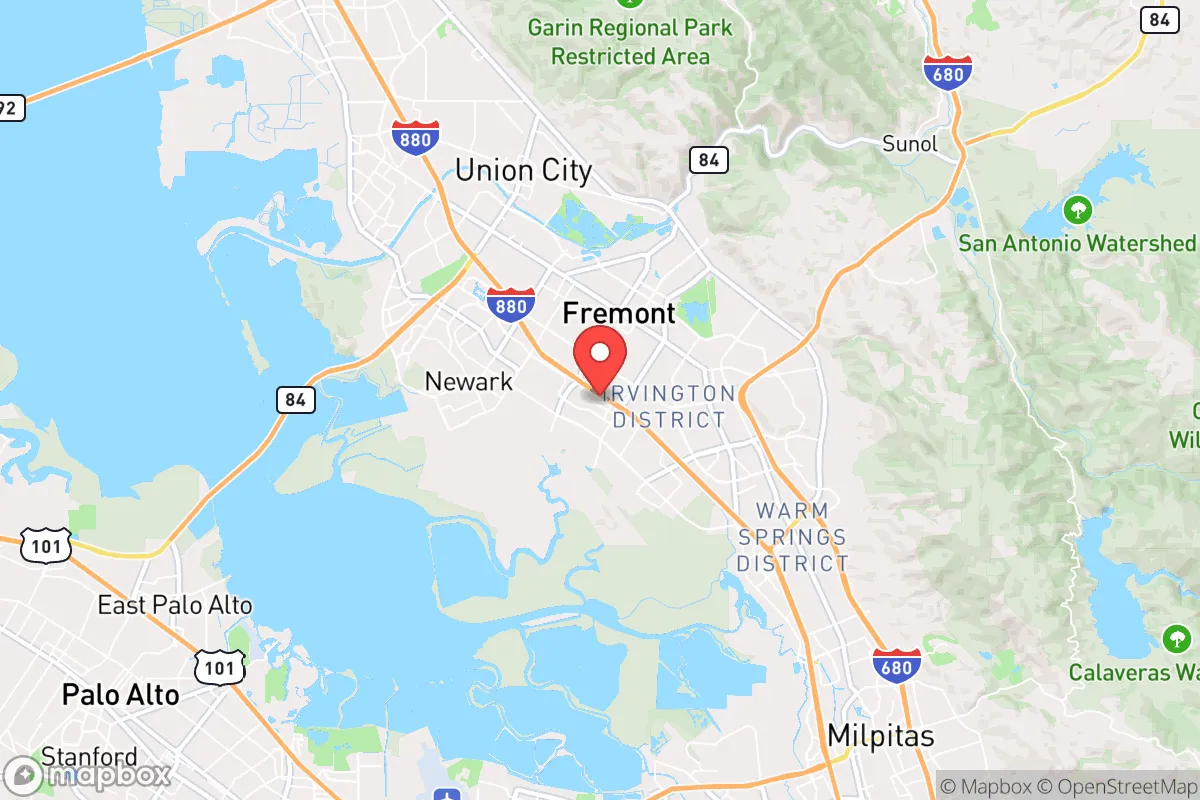
Demographics of Fremont, CA
Affluence Level in Fremont, CA
A wealthy area with high-earning, well-educated households. Incomes, home values, and educational attainment meaningfully outpace national averages.
People of Fremont, CA
Fremont, California is a majority-minority city of 228,518 residents defined by its dual Asian and Indian plurality, a highly educated workforce (62.7% college-educated), and a suburban character shaped by decades of tech-driven migration. The city is neither a traditional melting pot nor a single ethnic enclave; rather, it is a collection of distinct neighborhoods where different waves of settlement have created visible demographic boundaries. Foreign-born residents make up 22.1% of the population, and the city’s identity is increasingly shaped by the competition and coexistence of East/Southeast Asian (31.3%) and Indian-subcontinent (31.1%) communities, alongside a shrinking white population (17.2%), a stable Hispanic population (12.9%), and a small Black population (2.8%).
How the city was settled and grew
Fremont was incorporated in 1956 as a planned consolidation of five smaller communities—Centerville, Niles, Irvington, Mission San Jose, and Warm Springs—each with its own distinct origin story. The area’s first significant non-Native population arrived during the Spanish mission era (late 1700s), centered on Mission San Jose, which drew Mexican and Spanish settlers. After California statehood in 1850, the region became agricultural, with wheat and fruit orchards worked by a mix of European immigrants (Portuguese, Italian, German) and a small number of Chinese laborers who built the transcontinental railroad. By the early 20th century, Niles emerged as a silent-film hub, attracting a transient creative class, while Centerville and Irvington remained farming crossroads. The 1940s and 1950s brought a wave of white middle-class families from the East Coast and Midwest, drawn by defense-industry jobs at nearby Lockheed Martin and the Naval Air Station Moffett Field. These families settled primarily in the Northgate and Glenmoor neighborhoods, which remain among the city’s whitest and most affluent areas today.
Modern era (post-1965)
The 1965 Hart-Celler Immigration Act fundamentally reshaped Fremont. The first major post-1965 wave was East/Southeast Asian—primarily Chinese and Filipino families—who arrived in the 1970s and 1980s, drawn by affordable housing and proximity to Silicon Valley’s growing tech sector. They concentrated in Irvington and Warm Springs, where Chinese-language signage, supermarkets, and Buddhist temples became common. A second wave, beginning in the 1990s and accelerating through the 2000s, brought Indian-subcontinent immigrants—engineers, doctors, and IT professionals—who bypassed older ethnic clusters and settled directly in newer developments like Mission San Jose and the hillside homes above Ardenwood. Today, Mission San Jose’s public schools are among the highest-rated in California, and the neighborhood’s population is overwhelmingly Indian and East Asian, with white families a distinct minority. Meanwhile, the Hispanic population, largely Mexican-American, has remained concentrated in the older, more affordable Centerville district, where a lower cost of living and multi-generational households sustain a distinct cultural identity. The Black population, never large, has declined from 5.5% in 1990 to 2.8% today, with many families moving to more affordable inland suburbs like Tracy or Antioch.
The future
Fremont’s demographic trajectory points toward continued ethnic stratification rather than wholesale homogenization. The Indian-subcontinent population is the fastest-growing segment, driven by high-skilled H-1B visa holders and their families, and is projected to approach 35-40% of the city within a decade. East/Southeast Asian communities are growing more slowly, as many second-generation Chinese and Filipino families move to newer exurbs like Dublin or Pleasanton. The white population is aging and shrinking, with few young white families moving in. The Hispanic population is stable but not growing, constrained by housing costs that push younger families to Tracy or Patterson. The city is not tribalizing into hostile enclaves, but it is sorting by income and education: Mission San Jose and Ardenwood are increasingly high-income, high-education Indian and East Asian neighborhoods; Centerville remains working-class and Hispanic; Northgate and Glenmoor are older, whiter, and slowly turning over. The next 10-20 years will likely see Fremont become even more Asian-Indian in character, with English spoken as a second language in many homes and a civic culture shaped by tech-industry values—meritocratic, high-pressure, and family-focused.
For a conservative-leaning newcomer, Fremont offers a stable, safe, and highly educated environment, but it is not a culturally conservative city in the traditional sense. The dominant values are technocratic and family-centric, with strong emphasis on academic achievement and property investment. The city is becoming less diverse in the sense of racial mixing within neighborhoods, even as it remains diverse in aggregate. A move to Fremont means joining a community where the public schools are excellent, the streets are safe, and the neighbors are likely to be engineers—but where the cultural and political center of gravity is firmly Asian-Indian and East Asian, not white or Hispanic.
* Values derived from national, state, county, city and local statistics and may differ in a specific area. Last updated: 2026-04-30T04:17:46.000Z
Narrative content on this page is AI-generated and may contain mistakes. Verify any details that matter before acting on them.
ReloMaps may earn a commission from affiliate links at no extra cost to you.