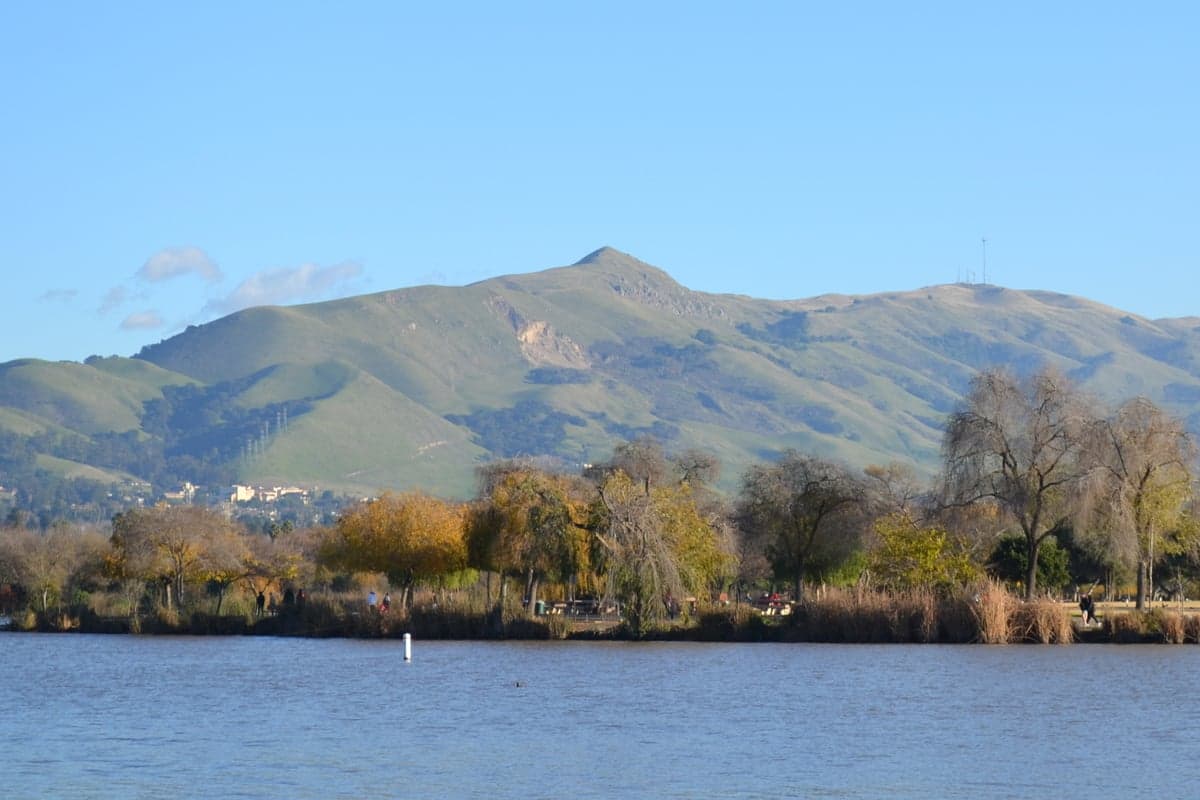
Photo: Wikipedia
Quality of Life in Fremont, CA
Above-average quality of iife. The area offers a reasonable cost of living, decent mobility, and a mix of neighborhood amenities.
What does Quality of Life tell us?
Quality of Life blends cost of living, nearby amenities, socioeconomic signals, and neighborhood character. City-level scores represent the whole municipality; individual neighborhoods can differ.
What does this tell us?
Quality of Life blends cost of living, nearby amenities, socioeconomic signals, and neighborhood character. City-level scores represent the whole municipality; individual neighborhoods can differ.
Cost of Living
233% above national average
The Real Cost of Living in Fremont, CA for 2026
| Tier | Individual | Family (4) |
|---|---|---|
| Survival | $46k | $87k |
| Comfortable | $181k | $266k |
| Luxury | $265k+ | $411k+ |
| Elite (Top 5%) | $312k+ | $484k+ |
66%
The Area Signal
A metric tracking the socioeconomic signals of the area.
Hobbies
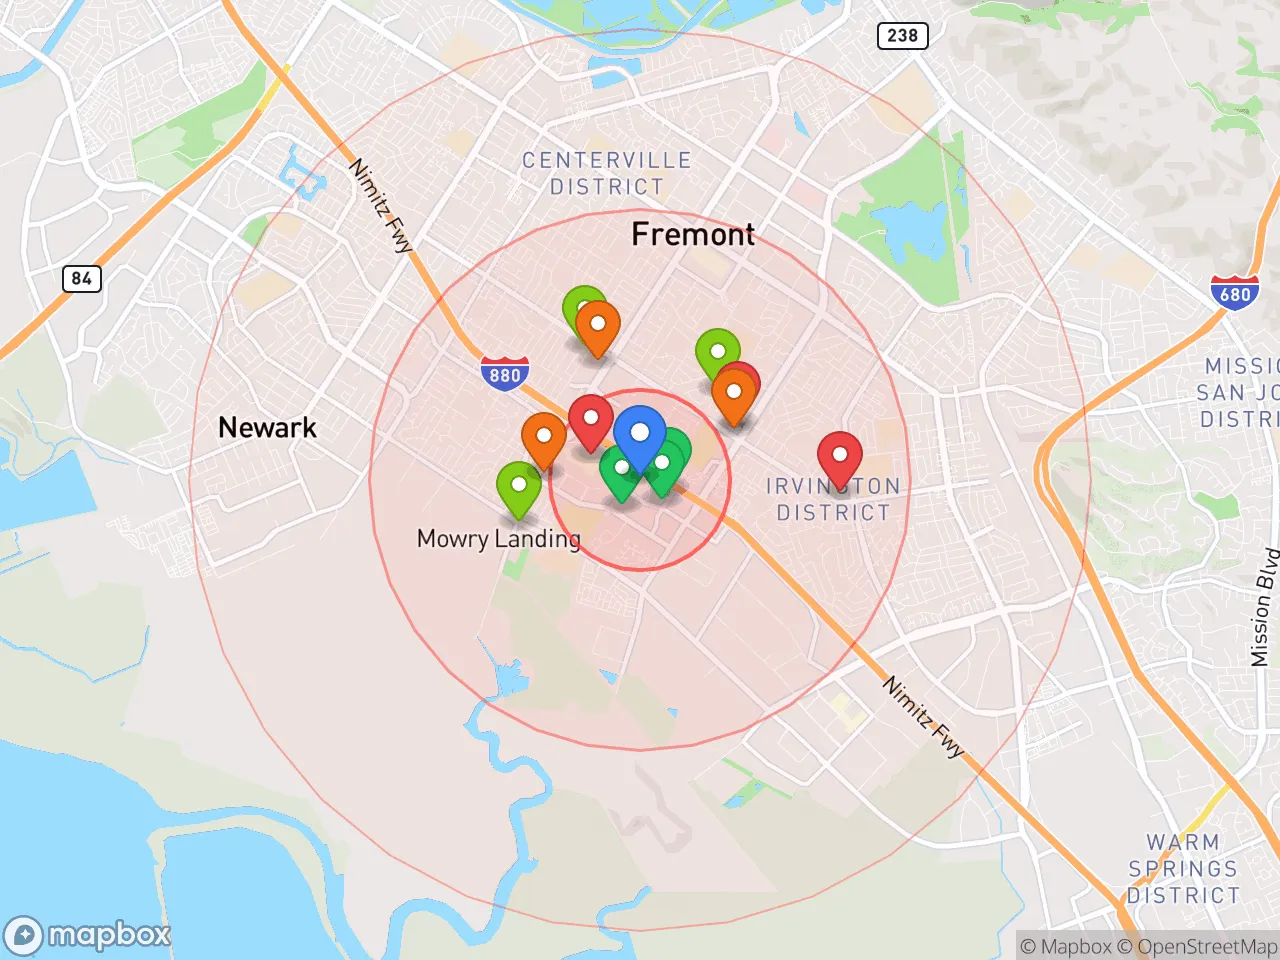
Explore the areaGroceries
7 within 10 miles
Gas
20 within 10 miles
Hospital
20 within 20 miles
Airport
SJC — San Jose International
Post Office
USPS — Fremont, CA
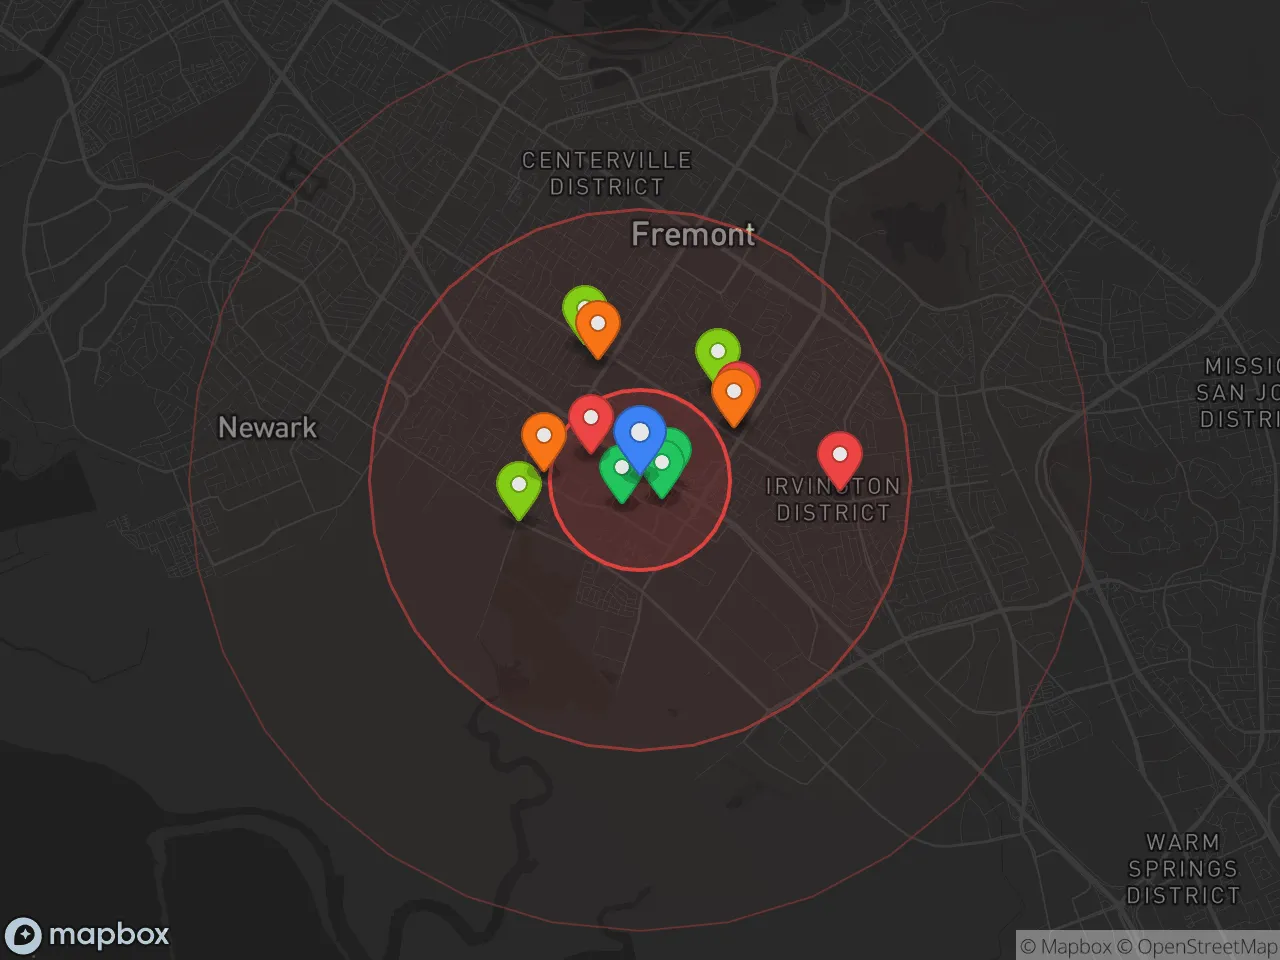
Critical Amenities
Quality-of-Life Analysis
Fremont, California, is a high-cost, high-opportunity city in the East Bay region of the San Francisco Bay Area, consistently ranking among the most affluent large cities in the United States. With a cost of living index of 333—more than three times the national average—the city attracts a population of well-educated professionals, many of whom work in nearby Silicon Valley tech hubs. The median household income hovers well above $150,000, and the city is known for its large Asian-American and immigrant communities, drawn by top-tier schools and a reputation for safety and stability.
Cost of living, housing affordability, and how Fremont compares to nearby cities
Fremont’s housing market is among the most expensive in the Bay Area, though it remains slightly more attainable than neighboring Palo Alto or Cupertino. The median home value sits at $1,289,400, while the median rent is $2,905 per month—both far above national medians but roughly 15-20% lower than comparable cities in Santa Clara County. The average commute time of 31.1 minutes reflects the reality that many residents travel south to San Jose or north to Oakland and San Francisco for work, often via Interstate 880 or BART. For renters, a one-bedroom apartment typically costs $2,400–$2,800, and homeownership requires a household income well above $300,000 to comfortably afford a mortgage. Compared to San Francisco proper, Fremont offers more square footage and newer housing stock, but the trade-off is a longer commute and a less urban lifestyle.
What daily life is like: amenities, schools, and community rhythm
Daily life in Fremont centers on its highly rated public schools, abundant parks, and family-oriented atmosphere. The Fremont Unified School District consistently earns GreatSchools ratings of 8–10 for most elementary and middle schools, with Mission San Jose High School and Irvington High School frequently ranked among the top in California. The city operates over 50 parks, including the 500-acre Coyote Hills Regional Park, and offers extensive bike trails along the Alameda Creek corridor. Dining and shopping are concentrated around the Fremont Hub, Pacific Commons, and the historic Niles district, which features antique shops and a silent-film festival. The rhythm is decidedly suburban: weekends see families at Lake Elizabeth or the Central Park playground, while evenings are quiet outside the few downtown pockets. Tech workers often use BART’s Fremont station for a 50-minute ride to San Francisco, though many drive to offices in Santa Clara or Sunnyvale. The city lacks a vibrant nightlife scene, but its low violent crime rate—roughly 60% below the national average—is a major draw for families.
Fremont is best suited for families and professionals who prioritize excellent schools, safety, and space over urban excitement or affordability. The city works well for dual-income households with at least one tech-sector salary, as the cost of living demands a high income. Singles and young couples may find the social scene limited, while retirees on fixed incomes will struggle with housing costs. For those who can afford it, Fremont offers a stable, well-resourced environment with strong community ties and easy access to the broader Bay Area job market.
Crime in Fremont, CA
WARNING: The crime statistics are unreliable for this jurisdiction. Local authorities have either not reported or under reported their data to the FBI. This could be due to bad intentions, incompetence or technical issues. Regardless, we suggest skepticism.
Crime rates similar to the national median for U.S. locations.
Violent CrimeViolent Crime Analysis
Property CrimeProperty Crime Analysis
Crime Analysis
Fremont, California, presents a complex safety picture that is statistically safer than many Bay Area cities but still carries risks that potential residents should weigh carefully. With a violent crime rate of 328.5 per 100,000 residents and a property crime rate of 1,394.1 per 100,000, Fremont sits below the national average for violent crime but above it for property crime. However, the broader context of Alameda County’s progressive criminal justice policies—including district attorneys and judges who prioritize diversion and reduced sentencing—means that offenders often face minimal consequences, a factor that directly impacts public safety and victim justice.
Crime in context
Fremont’s violent crime rate is roughly 11% lower than the U.S. average of about 370 per 100,000, and significantly lower than nearby Oakland’s rate of over 1,200 per 100,000. Property crime, however, is a more pressing concern: Fremont’s rate is about 15% higher than the national average of roughly 1,200 per 100,000. These figures must be viewed through the lens of Alameda County’s justice system, where progressive policies—such as cash bail reform, early release programs, and reduced prosecution of property crimes—have been linked to rising recidivism. For example, a 2023 report from the California Department of Justice noted that Alameda County’s property crime clearance rate fell to 6.8%, meaning over 93% of thefts, burglaries, and vehicle break-ins go unsolved. This environment emboldens repeat offenders and undermines deterrence.
What residents experience
Residents report that property crime is the most visible safety issue, with car break-ins, package thefts, and catalytic converter thefts being common complaints on neighborhood forums like Nextdoor and Fremont Police Department crime maps. The city’s auto burglary rate has spiked 22% since 2021, driven largely by organized theft rings operating across the Bay Area. Violent crime, while less frequent, includes incidents of robbery and aggravated assault, often concentrated near transit hubs like the Fremont BART station. A 2024 city survey found that only 54% of residents felt safe walking alone at night, a figure that reflects unease despite the relatively low violent crime numbers. The progressive judicial philosophy in Alameda County—which emphasizes rehabilitation over incarceration—means that even arrested offenders are often released quickly, a pattern that frustrates victims and erodes trust in the system.
Neighborhood-level variation is significant. Areas like Mission San Jose and North Fremont (near the hills) report the lowest crime rates, with violent crime below 200 per 100,000, while Central Fremont and the Irvington district (closer to the BART station and major retail corridors) see higher property crime and occasional violent incidents. The Warm Springs neighborhood, near the Tesla factory, has experienced a rise in vehicle thefts. For those considering a move, consulting the Fremont Police Department’s online crime map and speaking with local residents in specific neighborhoods is essential, as the city’s overall statistics can mask block-by-block differences shaped by proximity to transit, commercial zones, and the uneven enforcement resulting from county-level policies.
* Values derived from national, state, county, city and local statistics and may differ in a specific area. Last updated: 2026-04-30T04:17:46.000Z
Narrative content on this page is AI-generated and may contain mistakes. Verify any details that matter before acting on them.
ReloMaps may earn a commission from affiliate links at no extra cost to you.