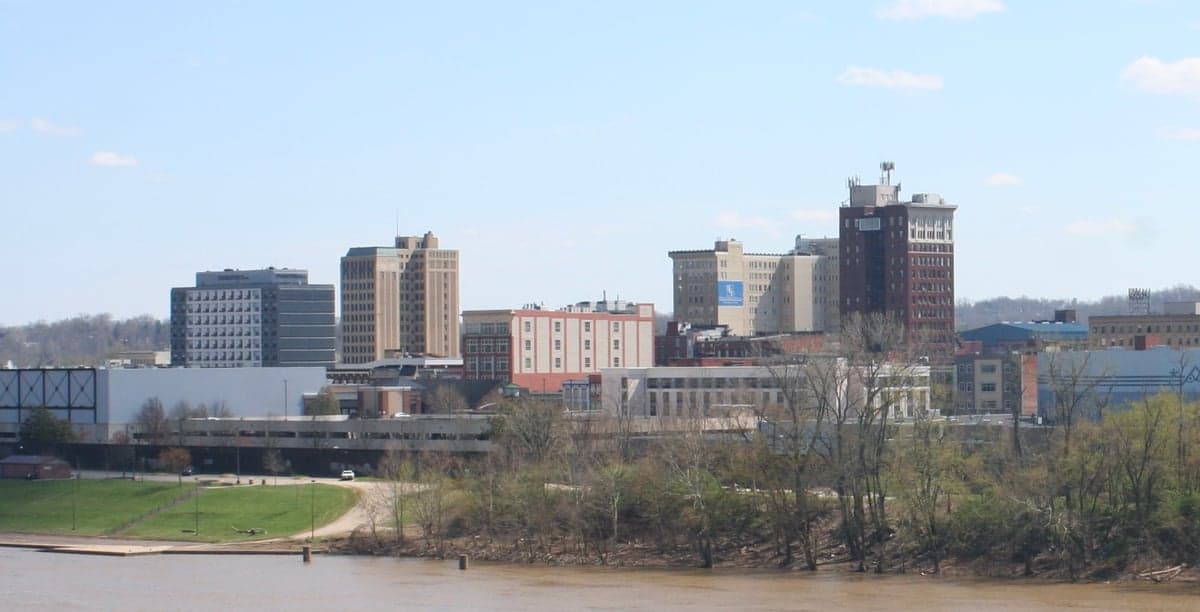
Photo: Wikipedia
Demographics of Huntington, WV
Affluence Level in Huntington, WV
A below-average socioeconomic profile. Incomes, home values, and educational attainment trail the U.S., with higher poverty and unemployment.
People of Huntington, WV
The people of Huntington, West Virginia, today number 46,189, forming a predominantly white (84.5%) and native-born (foreign-born at just 0.8%) population that is notably more educated than the state average, with 34.5% holding a college degree. The city’s character is shaped by a deep-rooted Appalachian and Rust Belt identity, a legacy of its industrial boom and subsequent decline, and a population that is older and more settled than the national median. Distinctive markers include a strong sense of local place, a reliance on Marshall University as an economic and cultural anchor, and a demographic profile that has seen modest diversification—primarily a Black population of 6.2% and small but present Hispanic (2.0%) and East/Southeast Asian (0.8%) communities—while remaining one of the least ethnically diverse cities of its size in the eastern United States.
How the city was settled and grew
Huntington was founded in 1871 by Collis P. Huntington, a railroad magnate who chose the confluence of the Ohio and Guyandotte Rivers as the western terminus of the Chesapeake and Ohio Railway. The original population was drawn by the promise of rail and industrial work, with the first wave consisting of skilled white laborers from the Ohio Valley and Pennsylvania, alongside a smaller number of Black workers who laid track and built the rail yards. These early residents settled in the Central City district, a working-class neighborhood that grew around the rail depot and remains a historic hub for the city’s Black community. By the early 1900s, the city’s population swelled with European immigrants—primarily German, Irish, and Italian—who found work in the burgeoning steel, glass, and chemical plants along the Ohio River. These groups concentrated in West Huntington and Fairfield, where ethnic churches and social clubs anchored their communities. The post-World War II era brought a second wave of domestic in-migration from rural Appalachia, as families left coal country for factory jobs at the Huntington Alloys plant and the Owens-Illinois glass factory. These migrants settled largely in Altizer and Guyandotte, older neighborhoods that expanded with modest single-family homes during the 1950s and 1960s.
Modern era (post-1965)
The post-1965 period marked a sharp reversal of Huntington’s growth trajectory. The city’s population peaked at 86,353 in 1950 and has declined steadily ever since, driven by deindustrialization and the loss of manufacturing jobs. The Hart-Cellar Act of 1965 had minimal impact on Huntington’s demographics, as the city’s economy and geography did not attract the large-scale immigration seen in coastal or Sun Belt cities. Instead, the modern era has been defined by domestic out-migration—younger, college-bound residents leaving for larger job markets—and a gradual suburbanization within the metro area. The South Side neighborhood, anchored by Marshall University, became a magnet for faculty, students, and professionals, giving it a more transient and educated character than the rest of the city. Meanwhile, the Black population, which had been concentrated in Central City and Fairfield since the early 1900s, has seen its share decline from roughly 12% in 1970 to 6.2% today, as many middle-class Black families moved to newer suburbs like Barboursville and Teays Valley. The small Hispanic (2.0%) and East/Southeast Asian (0.8%) communities are recent arrivals, largely tied to Marshall University’s international programs and healthcare jobs at Cabell Huntington Hospital, and they are dispersed rather than concentrated in a single ethnic enclave.
The future
Huntington’s population is projected to continue its slow decline, with the city likely to remain a predominantly white, native-born community for the foreseeable future. The foreign-born share (0.8%) is among the lowest in the nation and shows no signs of significant growth, as the region lacks the economic pull or established ethnic networks that drive immigration. The city is not tribalizing into distinct ethnic enclaves; rather, it is homogenizing as its small minority populations either age in place or leave for more diverse urban centers. The most notable demographic shift is the aging of the white population, with a median age of 39.5 that is several years above the national average. The next 10-20 years will likely see Huntington become whiter, older, and more dependent on Marshall University and the healthcare sector to retain any young families. The South Side will remain a pocket of relative diversity and education, while older neighborhoods like Altizer and Guyandotte will continue to depopulate as housing stock ages and job opportunities remain limited.
For someone moving in now, Huntington is a place where the past weighs heavily on the present. It is a shrinking, aging city with a stable but narrow demographic base, offering low housing costs and a strong sense of community for those who value rootedness over diversity. The city’s future is not one of rapid change but of gradual consolidation around its university and hospital anchors, making it a viable choice for families and individuals seeking an affordable, quiet, and historically grounded Appalachian lifestyle.
* Values derived from national, state, county, city and local statistics and may differ in a specific area. Last updated: 2026-05-01T19:31:08.000Z
Narrative content on this page is AI-generated and may contain mistakes. Verify any details that matter before acting on them.
ReloMaps may earn a commission from affiliate links at no extra cost to you.