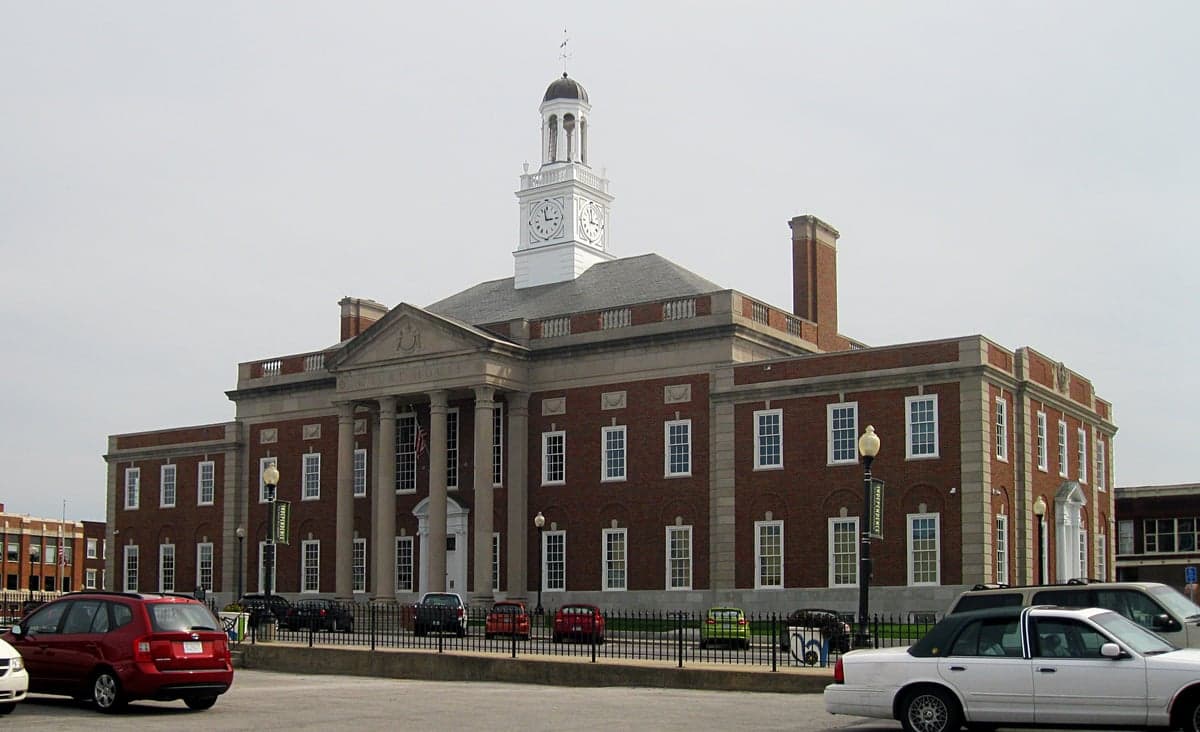
Photo: Wikipedia
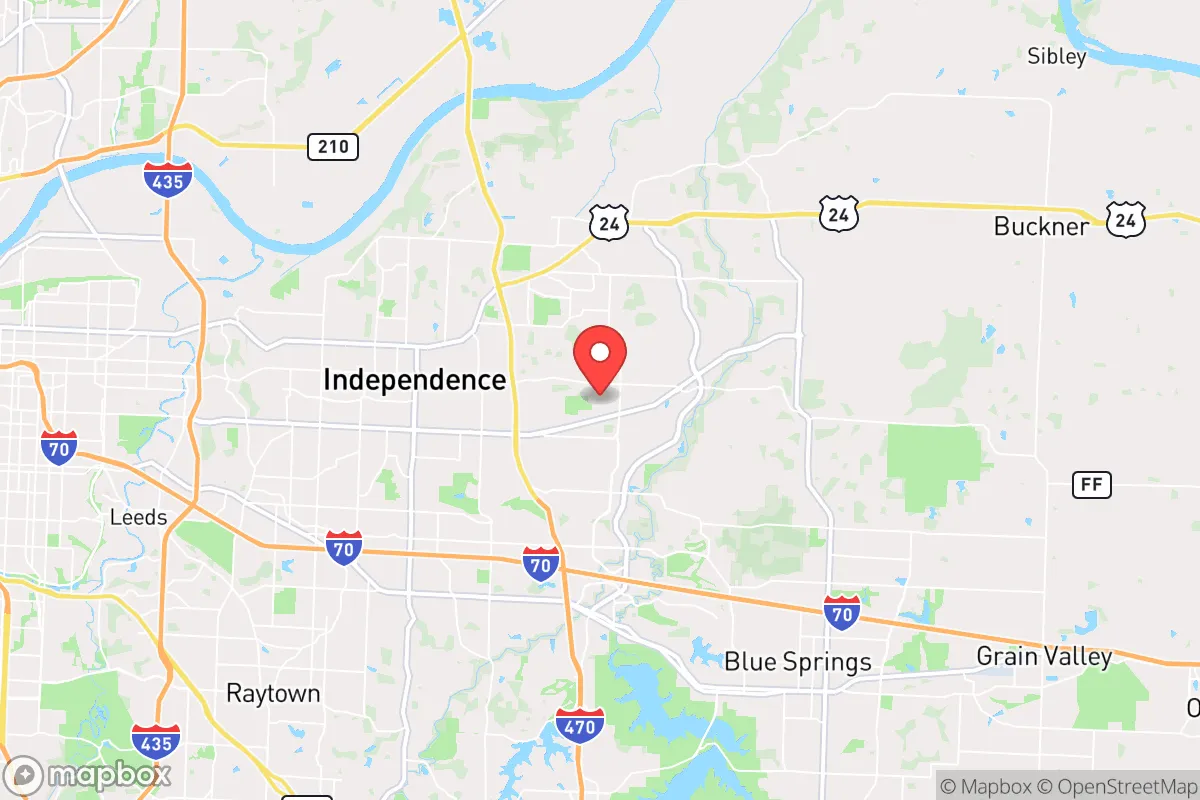
Demographics of Independence, MO
Affluence Level in Independence, MO
A below-average socioeconomic profile. Incomes, home values, and educational attainment trail the U.S., with higher poverty and unemployment.
People of Independence, MO
The people of Independence, Missouri, today number roughly 122,000, forming a predominantly white (69.2%) and notably less diverse city than the Kansas City metro area it anchors. With a foreign-born population of just 3.3% and a college attainment rate of 20.9%, Independence retains a distinctly working-to-middle-class, native-born character, shaped by its legacy as a frontier gateway and a mid-century manufacturing hub. The city’s identity is rooted in its historic role as the “Queen City of the Trails,” but its modern population reflects decades of suburban stagnation and selective in-migration, creating a community that is stable, aging, and increasingly Hispanic.
How the city was settled and grew
Independence was founded in 1827 as a river port and jumping-off point for the Santa Fe, Oregon, and California Trails. Its original white settlers were largely Anglo-American migrants from the Upper South and Appalachia, drawn by cheap land and the promise of trade. The city’s first distinct neighborhood, the historic Square, became the commercial and civic core, housing merchants, teamsters, and outfitters who serviced westward emigrants. By the 1850s, the city was a flashpoint in the Border War over slavery, with pro-slavery settlers from Missouri clashing with free-state settlers from Kansas, a tension that left a lasting cultural imprint of Southern-leaning conservatism.
The post-Civil War era brought a second wave: German and Irish immigrants who worked on the railroads and in the limestone quarries that dotted the eastern edge of the city. These groups settled in the Fairmount neighborhood, building the stone churches and social halls that still define the area. The early 20th century saw a third wave of white migrants from the rural Ozarks and Midwest, drawn by the opening of the city’s first major employer, the Lake City Army Ammunition Plant (1941), which swelled the population to over 36,000 by 1950. These workers concentrated in the Noland Hills and Englewood subdivisions, which were built as postwar housing for plant employees and their families.
Modern era (post-1965)
The 1965 Hart-Cellar Act had a muted effect on Independence compared to larger cities. The foreign-born share remained low (3.3% today), and the city’s growth after 1970 was driven almost entirely by domestic white flight from Kansas City proper. Between 1970 and 1990, Independence absorbed tens of thousands of white families leaving the urban core, who settled in sprawling subdivisions like the Southside (south of 23rd Street) and the East Side (east of Noland Road). This in-migration pushed the city’s white share to over 90% by 1980, making it one of the most racially homogeneous large suburbs in the metro.
The post-2000 period brought two notable shifts. First, the Hispanic population grew from 3.5% in 2000 to 12.5% today, driven by Mexican and Central American immigrants working in construction, meatpacking, and the service industry. These families concentrated in the western edge of the city, near the Kansas City border, and in older housing stock around the Square. Second, the Black population rose from 4.5% in 2000 to 10.8% today, largely through spillover from Kansas City’s east side into Independence’s northern neighborhoods near U.S. 24. The East/Southeast Asian share (0.9%) and Indian-subcontinent share (0.4%) remain negligible, concentrated in a few professional households near the Independence Center mall area.
The future
The population trajectory points toward slow homogenization with a Hispanic overlay. The white share (69.2%) is declining at roughly 0.5% per year, while the Hispanic share (12.5%) is growing at about 0.3% annually. The Black share appears to have plateaued near 11%, and the Asian and Indian shares are growing only through small numbers of medical professionals at the Centerpoint Medical Center complex. The city is not tribalizing into distinct ethnic enclaves in the way that Kansas City has; instead, Hispanic families are dispersing across older neighborhoods, particularly in the Fairmount and Englewood areas, while white families remain dominant in the newer subdivisions south of 23rd Street.
The biggest demographic risk is out-migration of young adults. Independence has a median age of 39.8, above the national average, and its college attainment rate (20.9%) is well below the metro average of 35%. Without a major new employer or a shift in housing stock toward apartments and condos, the city will likely continue to lose its college-bound 18- to 29-year-olds to Kansas City, Overland Park, and Columbia. The foreign-born population, while growing, is unlikely to exceed 6-7% by 2035, given the city’s lack of refugee resettlement programs and its distance from major immigrant job networks.
For a conservative-leaning individual or family moving in now, Independence offers a stable, predominantly white, and politically conservative environment (Jackson County’s eastern precincts vote reliably Republican) with a growing Hispanic presence that is assimilating into the city’s existing cultural fabric. The city is not diversifying rapidly, but it is slowly becoming less white and less native-born. The key question for newcomers is whether the city can attract enough young families and professionals to replace its aging population, or whether it will continue its slow drift toward becoming a retirement and working-class bedroom community for Kansas City.
* Values derived from national, state, county, city and local statistics and may differ in a specific area. Last updated: 2026-04-29T21:11:02.000Z
Narrative content on this page is AI-generated and may contain mistakes. Verify any details that matter before acting on them.
ReloMaps may earn a commission from affiliate links at no extra cost to you.