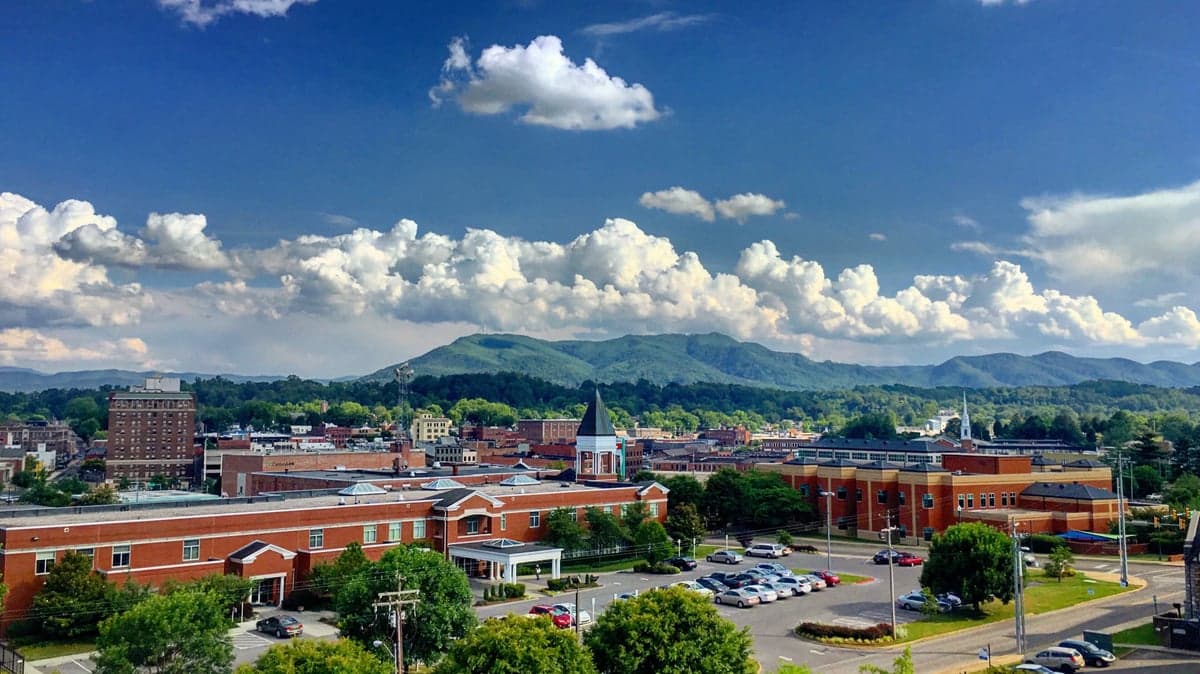
Photo: Wikipedia
Demographics of Johnson City, TN
Affluence Level in Johnson City, TN
A middle-class area roughly in line with national averages across income, home values, education, and employment.
People of Johnson City, TN
Johnson City, Tennessee, is home to 71,455 residents, a population that is 81.8% White, 6.3% Black, 5.6% Hispanic, and 1.4% East/Southeast Asian, with a notably low foreign-born share of just 2.8%. The city’s character is shaped by its roots as a railroad and medical hub in the Appalachian highlands, blending a strong sense of local tradition with a growing college-educated workforce (41.8%). Distinctive identity markers include a palpable civic pride in its historic downtown and a social fabric that remains predominantly native-born, with relatively small but stable minority communities.
How the city was settled and grew
Johnson City’s population history begins not with colonial settlement but with the arrival of the railroad in the 1850s. The town was formally incorporated in 1869, named after Henry Johnson, a railroad official. The original population was overwhelmingly of Scots-Irish and English descent, drawn from the surrounding rural areas of Washington County and the broader Appalachian region. These early residents were farmers, merchants, and railroad workers who built the city’s first neighborhoods. Tree Streets, a historic district just south of downtown, was developed in the late 19th and early 20th centuries and became the home of the city’s professional and merchant class. Meanwhile, the area around East Main Street housed railroad laborers and working-class families. The city’s first major growth wave came with the establishment of East Tennessee State University (ETSU) in 1911 and the founding of the Veterans Administration hospital in the 1940s, which drew medical professionals and support staff. A second wave of domestic in-migration occurred during the post-World War II industrial boom, when companies like Raytheon and North American Rayon opened plants, attracting workers from rural Appalachia and the Deep South. These workers settled in neighborhoods like Carroll Creek and the Boones Creek area, which expanded as suburban subdivisions in the 1950s and 1960s. The Black population, which had a small but historic presence dating to the late 1800s, was concentrated in the Piney Grove and Carver neighborhoods near the city’s core, where churches and community institutions anchored the community.
Modern era (post-1965)
After the 1965 Hart-Cellar Act, Johnson City saw only a modest increase in foreign-born residents, unlike larger Southern cities. The foreign-born share remains at 2.8%, far below the national average. The Hispanic population, now 5.6%, began growing in the 1990s and 2000s, driven by labor demand in construction, landscaping, and food processing. Many Hispanic families settled in the western side of the city near the I-26 corridor and in the South Roan Street area, where affordable housing and service jobs are concentrated. The East/Southeast Asian community (1.4%) is small but visible, with many families connected to ETSU’s medical programs or to small businesses; they are scattered across the city, with a slight concentration near the university. The Indian-subcontinent population (0.5%) is similarly tied to the medical and tech sectors, with no single ethnic enclave. Domestic in-migration has been the dominant demographic force since the 1990s. Retirees and remote workers from Florida, the Northeast, and the Midwest have moved into newer subdivisions like the Knob Creek area and the Ridges, drawn by lower taxes and a slower pace of life. This influx has made the city whiter than the national average, as the new arrivals are overwhelmingly non-Hispanic White. The Black population, at 6.3%, has remained stable in absolute numbers but has declined as a share of the total due to overall growth. The historic Black neighborhoods of Piney Grove and Carver have seen some gentrification pressure as downtown redevelopment pushes outward.
The future
The population of Johnson City is heading toward continued moderate growth, likely reaching 80,000 by 2035. The city is not tribalizing into distinct ethnic enclaves; instead, it is homogenizing as new White domestic migrants outpace minority growth. The Hispanic population is growing slowly, primarily through births rather than new immigration, and is assimilating into the broader community rather than forming a large barrio. The East/Southeast Asian and Indian communities are expected to remain small, tied to specific professional niches at ETSU and the medical district. The biggest demographic shift will be age-related: the city is attracting younger families to subdivisions like the Ridges while also drawing retirees to 55+ communities near the Boones Creek area. This dual inflow will keep the city’s median age stable but will increase demand for both schools and senior services. The foreign-born share is unlikely to rise above 4% in the next decade, given the city’s location in a region with low immigration infrastructure and a cultural climate that does not strongly attract newcomers.
For someone moving in now, Johnson City is becoming a more prosperous, slightly more diverse, but still overwhelmingly native-born and White community. The city’s growth is driven by domestic migration, not international immigration, and its neighborhoods remain largely defined by income and lifestyle rather than ethnicity. New arrivals will find a place where tradition and stability are valued, and where the population is slowly aging and suburbanizing rather than rapidly transforming.
* Values derived from national, state, county, city and local statistics and may differ in a specific area. Last updated: 2026-05-02T03:06:26.000Z
Narrative content on this page is AI-generated and may contain mistakes. Verify any details that matter before acting on them.
ReloMaps may earn a commission from affiliate links at no extra cost to you.