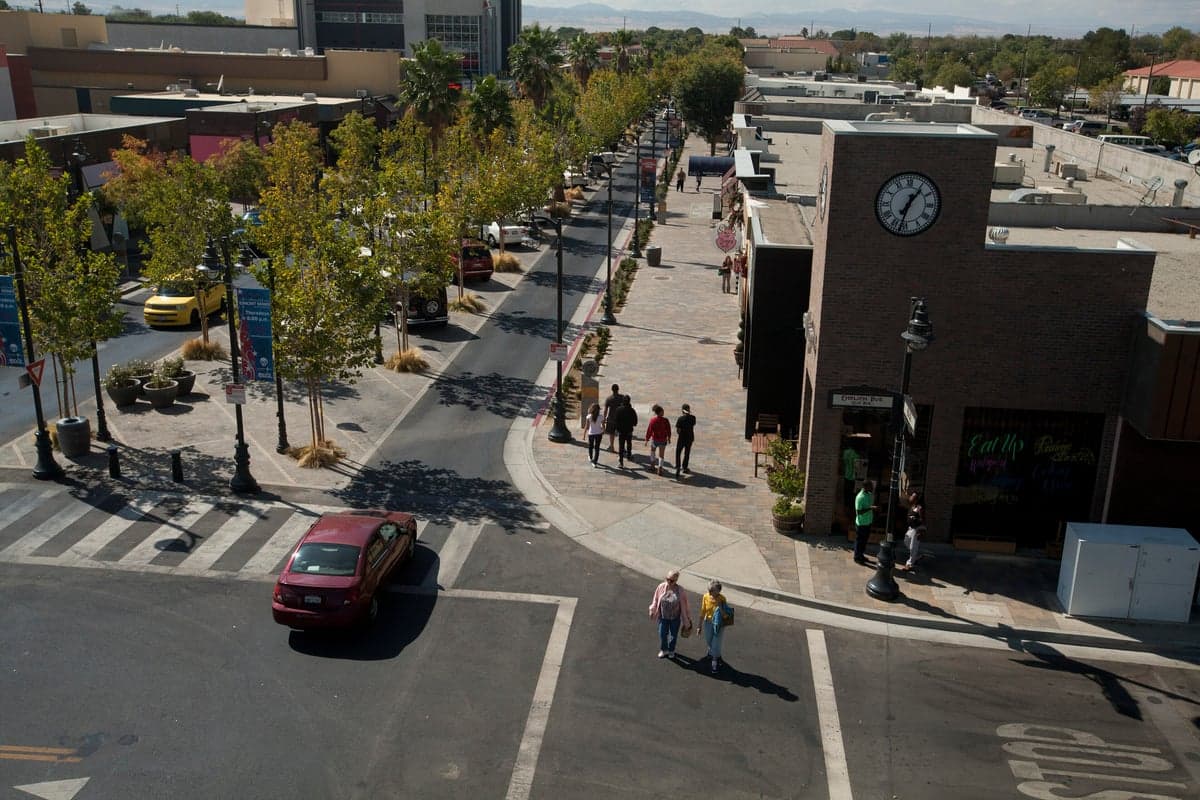
Photo: Wikipedia
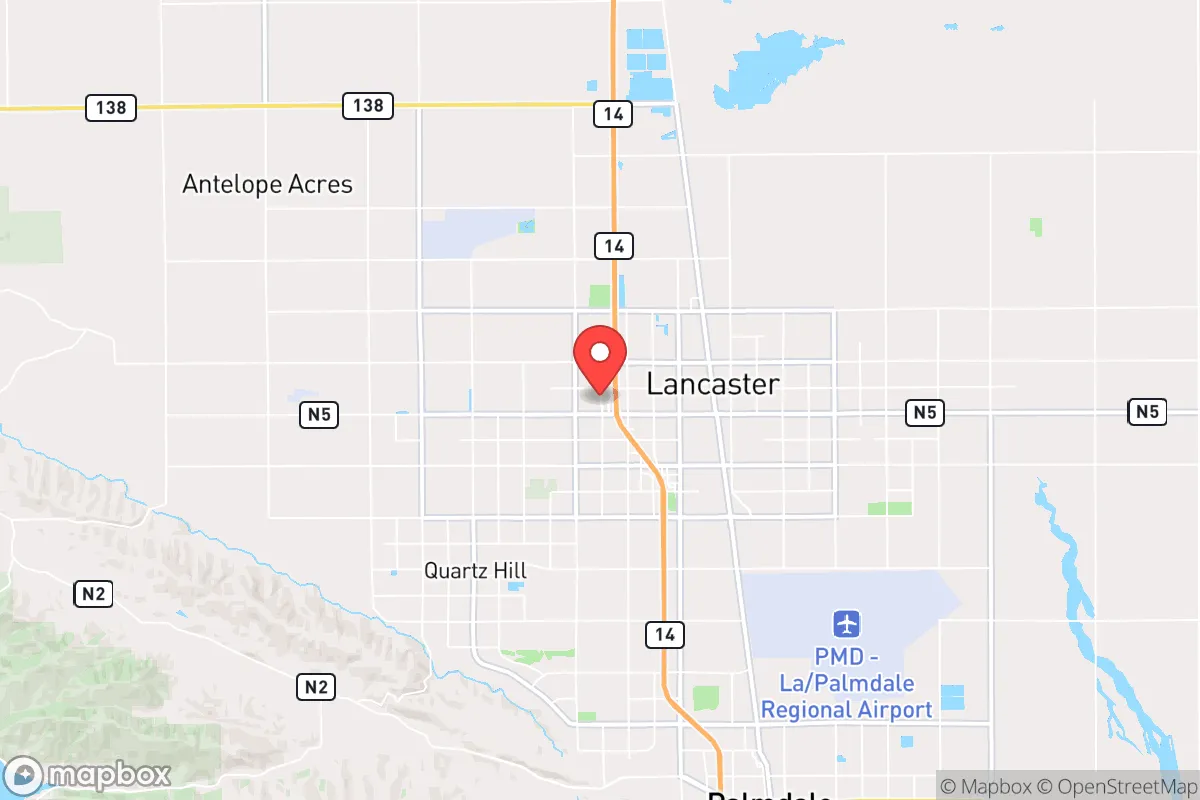
Demographics of Lancaster, CA
Affluence Level in Lancaster, CA
A middle-class area roughly in line with national averages across income, home values, education, and employment.
People of Lancaster, CA
The people of Lancaster, California, today form a majority-minority community of roughly 170,000, defined by a strong Hispanic plurality (45.9%), a substantial Black population (21.0%), and a White non-Hispanic share of 24.4%. The city’s identity is shaped by its roots as a post-World War II aerospace hub and its evolution into a more affordable, family-oriented alternative to Los Angeles County, with a notably lower foreign-born share (5.9%) than the state average. Lancaster’s population is younger and less college-educated (20.1%) than the county as a whole, reflecting a working-class character that leans conservative on issues like public safety and local governance.
How the city was settled and grew
Lancaster’s human history is almost entirely a 20th-century story. The area was originally inhabited by the Kitanemuk people, but the city itself was founded in 1884 as a stop on the Southern Pacific Railroad, named after a railroad official. For decades it remained a sparse agricultural outpost, with small numbers of homesteaders and ranchers. The first major population wave arrived during World War II, when the U.S. Army Air Forces established Muroc Field (later Edwards Air Force Base) nearby. This drew engineers, mechanics, and support staff, many of whom settled in the Old Town Lancaster district, the historic core around Lancaster Boulevard. The post-war boom of the 1950s and 1960s saw a second wave: defense contractors like Lockheed and Northrop opened facilities at nearby Plant 42 in Palmdale, and Lancaster became a bedroom community for aerospace workers. This era brought a predominantly White, middle-class population to neighborhoods like West Lancaster, where ranch-style homes on large lots became the norm. The city incorporated in 1977, cementing its identity as a planned, car-dependent suburb.
Modern era (post-1965)
The 1965 Hart-Cellar Act had a delayed but significant effect on Lancaster. Unlike coastal Los Angeles, Lancaster did not see large-scale immigration from Asia or Latin America until the 1980s and 1990s. Instead, the city’s modern demographic shift has been driven primarily by domestic migration. The 1992 Los Angeles riots triggered a notable exodus of Black families from South Los Angeles into the Antelope Valley, seeking safer neighborhoods and affordable housing. This wave concentrated in the East Lancaster area, east of the Sierra Highway, where Black homeownership rates rose sharply. By 2020, the Black population had reached 21.0%, one of the highest shares of any city in Los Angeles County. Hispanic growth accelerated in the same period, driven by both domestic relocation from the San Fernando Valley and some immigration from Mexico and Central America. Hispanic families settled heavily in Sun Village (an unincorporated area adjacent to Lancaster) and the Quartz Hill district, a semi-rural area west of the city center. The White non-Hispanic share fell from over 60% in 1990 to 24.4% by 2024, as older aerospace families aged out or moved to lower-cost states. East/Southeast Asian communities (3.6%) and Indian-subcontinent residents (0.3%) remain small, concentrated in newer subdivisions near Lancaster’s Westside around Avenue K and 30th Street West.
The future
Lancaster’s population is likely to continue its trajectory toward a Hispanic-majority, Black-minority composition, with the White share stabilizing or declining slowly. The foreign-born share (5.9%) is low and not rising quickly, suggesting that future growth will come from domestic migration and natural increase rather than new immigration. The city is not tribalizing into starkly separate enclaves—most neighborhoods are moderately integrated—but East Lancaster remains predominantly Black, while Quartz Hill and West Lancaster lean more White and Hispanic. The biggest wildcard is economic: Lancaster is actively recruiting aerospace and renewable-energy employers (e.g., the planned AVTEC electric-vehicle plant), which could attract a more educated, higher-income population. If successful, this could slow the Hispanicization trend and bring a modest increase in Asian and Indian residents. However, the city’s low college-attainment rate (20.1%) and distance from coastal job centers suggest it will remain a working-class suburb, not a tech hub. The next 10-20 years will likely see Lancaster become more Hispanic (approaching 55-60%), with a stable Black share and a shrinking but still significant White minority.
For a conservative-leaning individual or family moving to Lancaster today, the city offers a relatively affordable, family-oriented environment with a strong sense of local identity and a population that is predominantly U.S.-born. The demographic trends point toward a more Hispanic and working-class future, but the city’s political character—shaped by its aerospace heritage and low immigration—is likely to remain center-right on fiscal and public-safety issues. Lancaster is becoming a place where domestic migrants from across California and the Southwest converge, not a gateway for new arrivals, which aligns with the preferences of many conservative homebuyers seeking stability and community.
* Values derived from national, state, county, city and local statistics and may differ in a specific area. Last updated: 2026-04-24T14:31:54.000Z
Narrative content on this page is AI-generated and may contain mistakes. Verify any details that matter before acting on them.
ReloMaps may earn a commission from affiliate links at no extra cost to you.