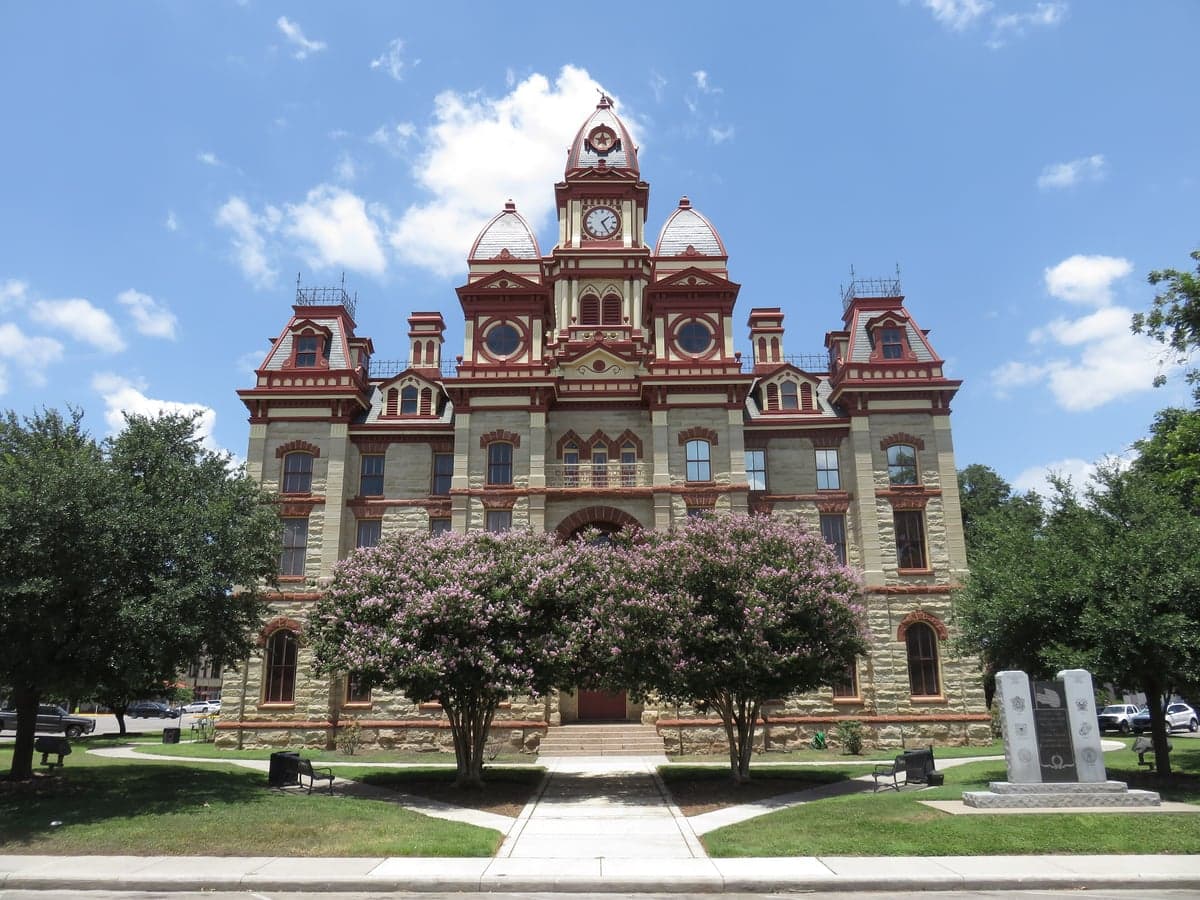
Photo: Wikipedia
Demographics of Lockhart, TX
Affluence Level in Lockhart, TX
A middle-class area roughly in line with national averages across income, home values, education, and employment.
People of Lockhart, TX
The people of Lockhart, Texas, today form a predominantly Hispanic (52.9%) and White (37.3%) community of 14,708 residents, with a notably low foreign-born share of just 3.0%. This is a working-class, family-oriented city where only 16.7% of adults hold a college degree, and the population density reflects a small-town Texas character centered around the historic courthouse square. Lockhart’s identity is rooted in its role as a regional hub for Caldwell County government and its nationally recognized barbecue culture, but its human history is one of steady, layered migration rather than explosive growth.
How the city was settled and grew
Lockhart was founded in 1848 as the seat of Caldwell County, named after Byrd Lockhart, a surveyor and veteran of the Texas Revolution. The original Anglo-American settlers arrived from the southern United States, drawn by land grants offered by the Republic of Texas. These families established cotton plantations and small farms, clustering around the central square in what is now Historic Downtown Lockhart. By the late 19th century, German and Czech immigrants began arriving, recruited by railroad expansion and agricultural opportunities. They settled in the North Lockhart area, building modest homes and establishing the meat-smoking traditions that would later define the city’s barbecue fame. The Mexican-American population grew slowly through the early 1900s, primarily as farm laborers and railroad workers, forming a small enclave in the Southside neighborhood near the railroad tracks. The city remained overwhelmingly Anglo-American through the 1950s, with a population of roughly 5,000.
Modern era (post-1965)
The 1965 Hart-Cellar Immigration Act reshaped Lockhart’s demographics, though more gradually than in larger Texas cities. Mexican-American families, many already multi-generational residents, began moving from rural farm labor into town for steady jobs in meatpacking and construction. This wave concentrated in the Southside and West Lockhart neighborhoods, where modest frame houses and mobile homes became common. The Hispanic share of the population rose from roughly 15% in 1970 to over 50% by 2020, driven primarily by domestic migration from South Texas and natural increase rather than new immigration — the foreign-born share remains low at 3.0%. The White population, meanwhile, has declined in absolute numbers as younger Anglo families moved to larger metros like Austin and San Marcos for white-collar jobs. The Lockhart Estates subdivision, developed in the 1980s and 1990s, attracted a mix of middle-class Hispanic and White families seeking newer housing. The Black population, at 4.6%, is small but historically rooted, with families concentrated in the East Lockhart area near the former segregated school sites. East/Southeast Asian residents make up just 1.0% of the population, with no significant Indian subcontinent community recorded.
The future
Lockhart’s population is trending toward a more homogenized Hispanic-majority character, with the White share continuing a slow decline as older Anglo residents age out and younger families move to the Austin suburbs. The Hispanic population is largely U.S.-born and English-proficient, meaning the city is not experiencing the linguistic or cultural fragmentation seen in gateway immigrant cities. The Southside and West Lockhart neighborhoods are likely to remain the core Hispanic enclaves, while newer subdivisions like Cottonwood Creek and Plum Creek (on the city’s northern edge) are attracting a mix of young Hispanic families and a small number of White commuters working in Austin, 30 miles north. The college-educated share, at 16.7%, is low but may rise slowly as Austin’s housing costs push some professionals further out. No major immigrant wave from Asia or the Indian subcontinent is visible in the data, and the Black population is projected to remain stable. The city is not tribalizing into sharply divided enclaves; instead, it is becoming a predominantly Hispanic, working-class community with a stable Anglo minority and very limited ethnic diversity beyond those two groups.
For someone moving to Lockhart now, the city offers a solidly Hispanic-influenced, family-oriented small-town environment with a low cost of living and a strong sense of place centered on the courthouse square and barbecue culture. The population is not growing rapidly, and the demographic trajectory points toward a continued Hispanic majority with a shrinking White minority. New residents should expect a community where English is the dominant language, church attendance is high, and political leanings are conservative — Caldwell County voted +37 points Republican in the 2024 presidential election. Lockhart is not becoming a diverse, cosmopolitan suburb; it is remaining a stable, working-class Texas town with deep roots in its agricultural and meatpacking past.
* Values derived from national, state, county, city and local statistics and may differ in a specific area. Last updated: 2026-05-14T18:32:09.000Z
Narrative content on this page is AI-generated and may contain mistakes. Verify any details that matter before acting on them.
ReloMaps may earn a commission from affiliate links at no extra cost to you.