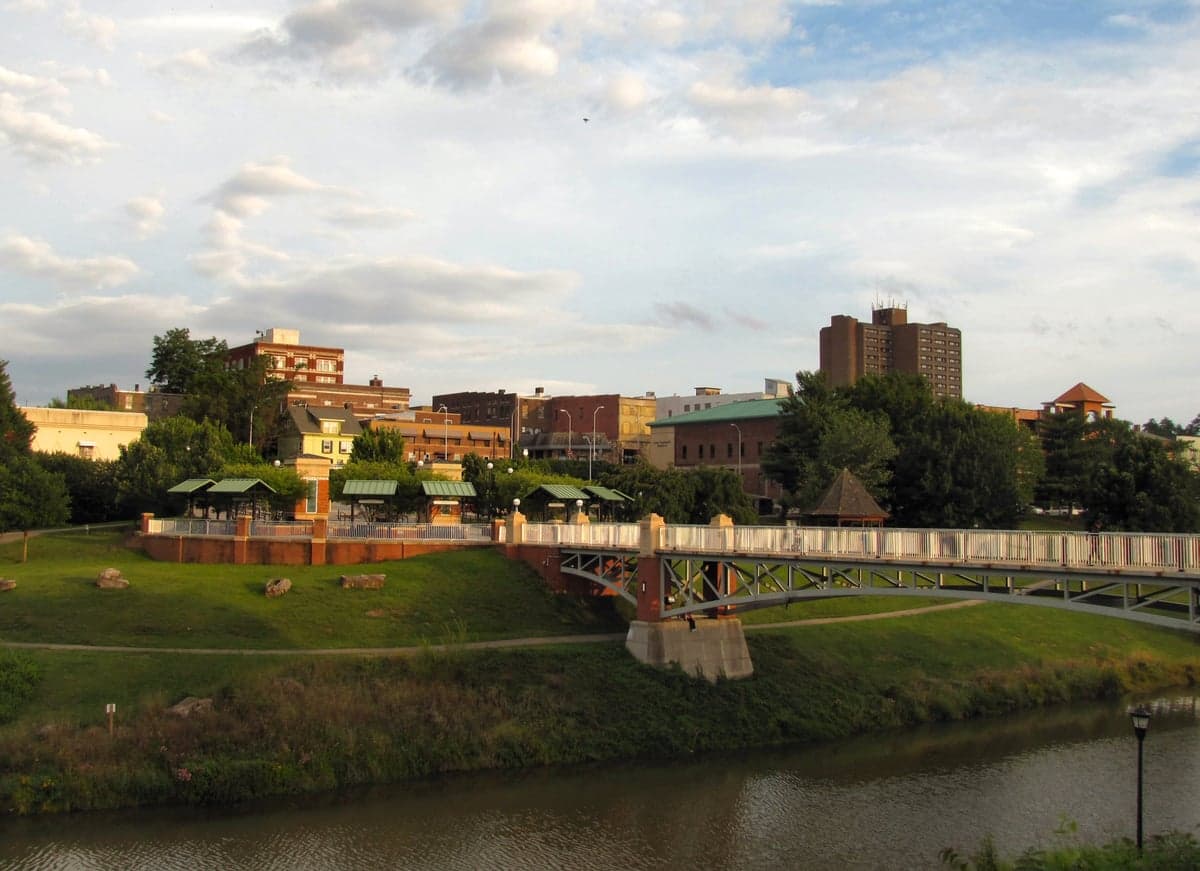
Photo: Wikipedia
Demographics of Maryville, TN
Affluence Level in Maryville, TN
A middle-class area roughly in line with national averages across income, home values, education, and employment.
People of Maryville, TN
The people of Maryville, Tennessee today form a predominantly white, family-oriented community of 32,196 residents, with a notably low foreign-born population of just 1.9% and a college attainment rate of 37.0%. The city's character is shaped by its roots as a small manufacturing and agricultural hub that has evolved into a bedroom community for nearby Knoxville and the University of Tennessee. Distinctive identity markers include a strong sense of local tradition, a growing number of families drawn by Blount County schools, and a population that remains overwhelmingly white (88.9%) with small but present Hispanic (4.1%), Black (2.8%), and East/Southeast Asian (1.4%) communities. The Indian subcontinent population is negligible at 0.1%.
How the city was settled and grew
Maryville was founded in 1795 on land originally inhabited by the Cherokee, with early white settlers arriving via the Great Valley Road from Virginia and North Carolina. The original population was overwhelmingly of Scots-Irish and English descent, drawn by land grants offered to veterans of the American Revolution and the promise of fertile farmland in the Little River Valley. By the mid-19th century, the town served as a trading center for surrounding farms, and its population remained small and homogeneous. The arrival of the railroad in the 1850s spurred modest growth, but the city's character was defined by its role as a county seat and agricultural market. The historic Old Town district, centered around the courthouse square, was built by these early settlers and their descendants, with many original homes still standing along Cates Street and Church Street. A second wave of growth came in the early 20th century with the establishment of textile mills and furniture factories, drawing rural white families from the surrounding Appalachian region. These workers settled in neighborhoods like Fort Craig and Montvale Station, areas that remain predominantly white and working-class today.
Modern era (post-1965)
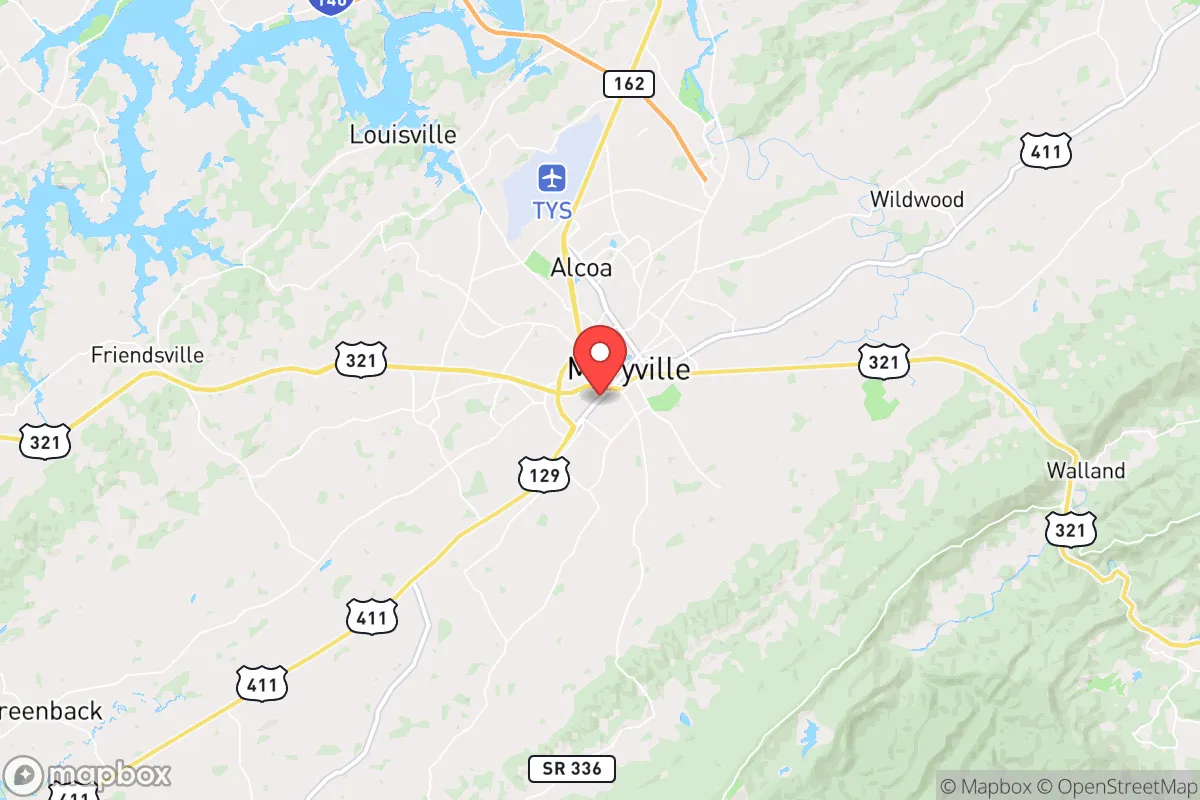
The post-1965 period brought limited demographic change to Maryville compared to larger Southern cities. The city did not experience significant immigration after the Hart-Cellar Act; the foreign-born share remains at just 1.9%, far below the national average. Instead, domestic in-migration has been the primary driver of population change. The completion of the Pellissippi Parkway in the 1990s connected Maryville more directly to Knoxville and the Oak Ridge corridor, triggering suburbanization. Newer subdivisions like Springbrook Farms and Meadowood attracted middle-class families, overwhelmingly white, seeking larger lots and lower taxes than Knox County. The Hispanic population, now 4.1%, began growing in the 2000s, driven by construction and landscaping jobs. These families are concentrated in the Everett Hills area and along the US-411 corridor south of downtown. The Black population, at 2.8%, is small and largely resides in the East Maryville neighborhood near the former site of the city's segregated school. The East/Southeast Asian population (1.4%) is primarily composed of professionals employed at the nearby Oak Ridge National Laboratory or at Denso Manufacturing, with families living in newer subdivisions like Brick Mill.
The future
Maryville's population is likely to continue growing slowly, driven by domestic in-migration from other parts of Tennessee and the Midwest, rather than by international immigration. The city is not homogenizing into a single identity, but rather tribalizing into distinct enclaves based on income and lifestyle: established families in historic neighborhoods, newcomers in suburban subdivisions, and a small but stable Hispanic community near the commercial corridors. The East/Southeast Asian population is expected to plateau, as it is tied to specific employers with limited expansion. The Indian subcontinent population will likely remain negligible. The Black population shows no signs of significant growth. The most notable trend is the aging of the white population in older neighborhoods like Old Town and Fort Craig, while younger families with children fill the newer subdivisions. The next 10-20 years will likely see Maryville become slightly more diverse in income and age, but its racial and ethnic composition will remain overwhelmingly white, with the Hispanic share possibly rising to 6-7% if current trends hold.
For someone moving in now, Maryville offers a stable, family-oriented community with low crime, strong schools, and a population that values tradition and local identity. The city is not a melting pot but a collection of distinct, largely homogeneous neighborhoods. Newcomers will find a welcoming but not rapidly diversifying environment, where the dominant culture remains rooted in the Scots-Irish and Southern heritage of its original settlers. The key decision for a relocating family is choosing which neighborhood aligns with their lifestyle—historic walkability, suburban space, or proximity to the commercial corridor—rather than navigating significant cultural or ethnic change.
* Values derived from national, state, county, city and local statistics and may differ in a specific area. Last updated: 2026-05-01T13:26:05.000Z
Narrative content on this page is AI-generated and may contain mistakes. Verify any details that matter before acting on them.
ReloMaps may earn a commission from affiliate links at no extra cost to you.