Demographics of Mason, WV
Affluence Level in Mason, WV
A low-income area with significant economic hardship. Household wealth and educational attainment are well below national averages.
People of Mason, WV
The people of Mason, West Virginia today form a small, tightly-knit community of 863 residents, characterized by its overwhelming racial and ethnic homogeneity—97.0% white, with a foreign-born population of just 0.5%. The city’s identity is rooted in its river-town heritage and a deeply local, family-oriented culture, where a low college attainment rate of 12.2% reflects a workforce historically tied to industry and trades rather than professional services. For a conservative-leaning individual or family, Mason offers a setting of stability and traditional values, though its population is aging and slowly declining.
How the city was settled and grew
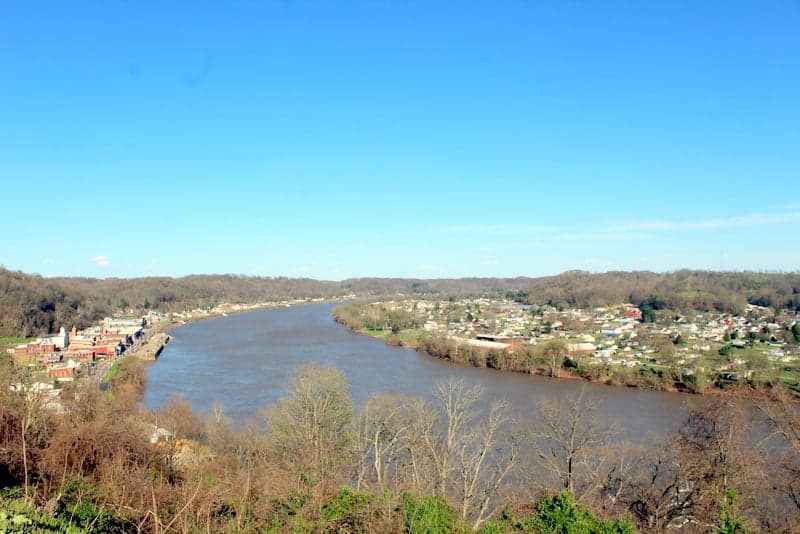
Mason’s settlement history is a story of river commerce and industrial opportunity. Founded in the mid-19th century along the Ohio River, the city was originally a landing point for flatboats and steamboats carrying goods and people. The first significant wave of settlers were Anglo-American farmers and merchants from Virginia and Pennsylvania, drawn by fertile bottomlands and the promise of trade along the river. By the late 1800s, the arrival of the Baltimore and Ohio Railroad spurred a second wave: German and Irish immigrants who built the rail lines and worked in the emerging salt and lumber industries. These groups established the Riverfront District along the Ohio, where the original commercial docks and warehouses stood, and the Railroad Flats area near the tracks, where workers’ cottages and boarding houses clustered. A third wave in the early 1900s brought a small number of Italian and Eastern European laborers to work in the local glass and brick factories, settling in the Hilltop neighborhood above the floodplain. By 1950, Mason’s population peaked near 1,200, with a nearly all-white, native-born character that would persist for decades.
Modern era (post-1965)
After the 1965 Hart-Cellar Act, Mason saw virtually no immigration-driven diversification. The foreign-born share remained below 1%, and the city’s racial composition stayed static—0.0% Black, 0.1% East/Southeast Asian, and 0.0% Indian subcontinent. Instead, the modern era was defined by domestic out-migration. The decline of river-based manufacturing and the closure of local glass and brick plants in the 1970s and 1980s prompted many working-age families to leave for larger cities like Huntington or Columbus. Those who remained were largely older residents and a smaller cohort of younger families employed in the remaining local industries—a chemical plant and a few small manufacturers. The West End neighborhood, once a mix of factory workers’ homes, saw many houses become vacant or converted to seasonal use. The Downtown Core along Main Street lost its grocery and hardware stores, shifting to a handful of churches, a post office, and a volunteer fire department. The only notable demographic shift was a slight increase in Hispanic residents (0.9%), mostly individuals working in agriculture or seasonal construction, who settled in scattered rental properties rather than forming a distinct enclave.
The future
Mason’s population trajectory points toward continued slow decline and further homogenization. With a median age likely in the mid-50s (based on state trends) and a college attainment rate of just 12.2%, the city lacks the economic magnets to attract young families or immigrants. The foreign-born population is negligible and not growing, and the Hispanic share is plateauing rather than expanding. No new ethnic enclaves are forming; the Old Town district, where the oldest homes sit along the river, is increasingly occupied by retirees and second-home buyers from outside the area. The South Ridge area, a post-2000 subdivision of single-family homes, has attracted a handful of younger families but remains overwhelmingly white and native-born. Over the next 10–20 years, Mason is likely to become smaller, older, and even more homogenous, with population potentially falling below 800. The city is not tribalizing into distinct enclaves but rather thinning out, with vacant properties concentrated in the older neighborhoods near the river and rail lines.
For someone moving in now, Mason is becoming a quiet, low-cost retirement and rural-living destination rather than a growing job center. Its appeal lies in its stability, low crime, and strong sense of community—but the trade-off is limited economic opportunity, a shrinking tax base, and a population that is not diversifying. Conservative families seeking a traditional, close-knit environment will find Mason welcoming, but should expect few newcomers and a gradual reduction in local services and amenities.
* Values derived from national, state, county, city and local statistics and may differ in a specific area. Last updated: 2026-04-23T06:01:21.000Z
Narrative content on this page is AI-generated and may contain mistakes. Verify any details that matter before acting on them.
ReloMaps may earn a commission from affiliate links at no extra cost to you.