Photo: Wikipedia
Demographics of Midlothian, TX
Affluence Level in Midlothian, TX
An upper-middle-class area. Household wealth, education levels, and homeownership run ahead of national benchmarks.
People of Midlothian, TX
The people of Midlothian, Texas, today number 37,256, forming a predominantly White (64.6%) and increasingly Hispanic (19.7%) community with a notable Black population (10.9%) and a very small foreign-born share (2.7%). The city retains a distinctly suburban character, with a college-educated rate of 35.2% and a median household income that consistently outpaces the national average, reflecting its role as a bedroom community for Dallas-Fort Worth commuters and a local hub for cement and limestone industries. Despite rapid growth, Midlothian’s population remains less diverse than the broader DFW metroplex, with East/Southeast Asian (0.3%) and Indian-subcontinent (0.1%) communities remaining tiny. The city’s identity is rooted in a blend of historic ranching families, post-war suburbanites, and newer Hispanic and Black families drawn by affordable housing and industrial jobs.
How the city was settled and grew
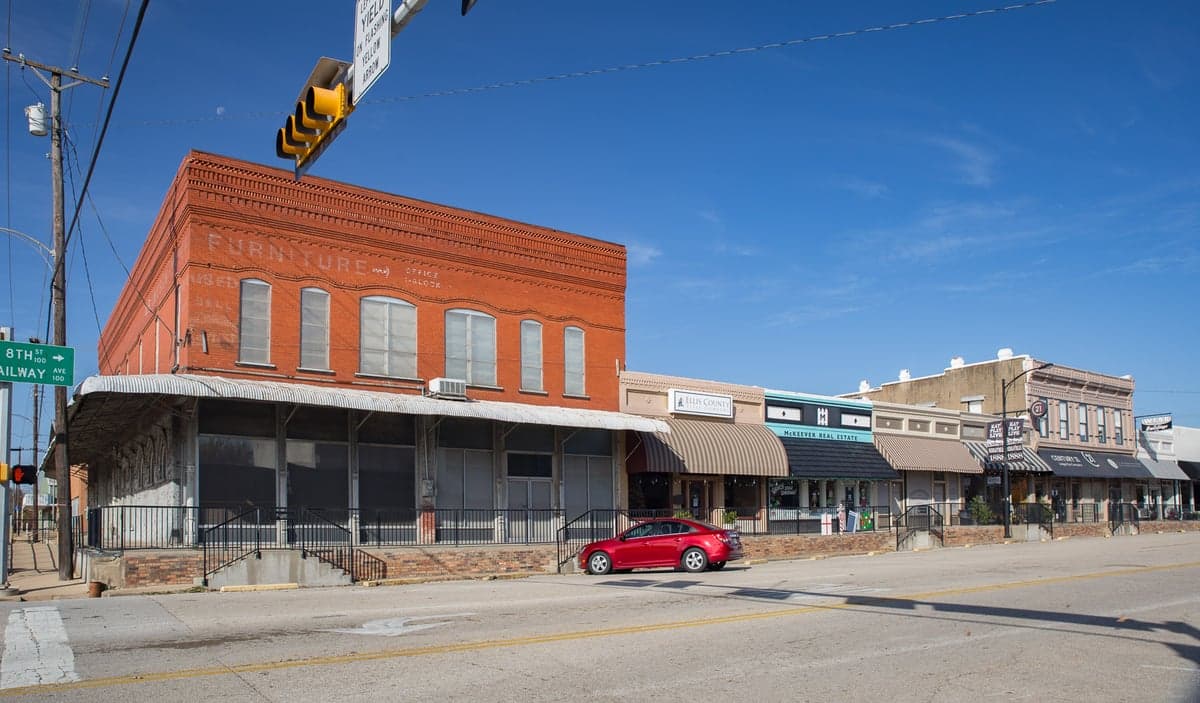
Midlothian’s population history begins not with colonial settlement but with the arrival of the railroad in the 1880s. The area was originally part of the Peters Colony land grant, attracting Anglo-American farmers from the Upper South—primarily Tennessee, Kentucky, and Missouri—who established cotton and cattle operations. The town was formally platted in 1887 around the St. Louis Southwestern Railway depot, and the first wave of residents clustered in what is now Historic Downtown Midlothian, centered on Main Street and the railroad tracks. These early families—names like Brown, Boren, and Hawkins—built the original wood-frame homes and brick storefronts that still define the district. A second wave arrived in the 1910s and 1920s as the cement industry took root, with the opening of the Texas Portland Cement Company (later Lehigh Hanson) drawing a mix of Anglo and Mexican laborers. These workers settled in the “Mexican Town” neighborhood (now largely absorbed into the area around East Avenue G and South 9th Street), a segregated enclave that housed the families of cement plant employees. By 1950, Midlothian’s population hovered around 1,500, overwhelmingly White and native-born, with a small Hispanic minority tied to the industrial workforce.
Modern era (post-1965)
The post-1965 period transformed Midlothian from a sleepy industrial town into a fast-growing suburb. The 1965 Hart-Cellar Act had little direct effect here—foreign-born residents remain just 2.7%—but the completion of US Highway 67 in the 1970s and the expansion of the Dallas-Fort Worth metroplex drove domestic in-migration. White families from Dallas and Tarrant counties moved south for larger lots and lower taxes, filling new subdivisions like Mockingbird Estates (off Mockingbird Lane) and Walnut Grove (near US 67 and FM 663), both developed in the 1980s and 1990s. The Hispanic population grew steadily during this period, rising from roughly 5% in 1980 to 19.7% today, driven by continued recruitment for the cement plants and later by service-sector jobs in retail and construction. Hispanic families concentrated in older neighborhoods like East Midlothian (east of US 67, around East Main Street) and in newer subdivisions such as Ridgeview Estates (off FM 663), where affordable starter homes attracted first-time buyers. The Black population, now 10.9%, began growing in the 1990s and 2000s, drawn by the same suburban affordability that pulled White families; they settled primarily in Stone Creek (south of US 67 near FM 875) and in the newer Bristol Park development (off East Highway 287). The Asian and Indian populations remain negligible—0.3% and 0.1% respectively—with no distinct ethnic enclave forming; these residents are scattered across newer subdivisions like Bristol Park and Walnut Grove.
The future
Midlothian’s population is heading toward continued growth and gradual diversification, but not toward the hyper-diverse profile of Dallas or Arlington. The city’s 2020-2030 growth rate is projected at roughly 25-30%, driven by new master-planned communities like Bristol Park (which will add over 2,000 homes) and the Midlothian Business Park expansion. The Hispanic share is likely to rise toward 25-30% over the next decade, fueled by natural increase and continued industrial recruitment, while the Black share may plateau around 12-15% as housing prices climb. The White share will continue to decline numerically but remain the majority. The East/Southeast Asian and Indian communities are unlikely to grow significantly unless a major employer relocates to the area; the city lacks the tech or medical anchor that typically draws these groups. The foreign-born share may inch up to 4-5% but will remain low by DFW standards. The city is not tribalizing into distinct enclaves—neighborhoods like Mockingbird Estates and Stone Creek are increasingly mixed—but older areas like East Midlothian will retain a stronger Hispanic character.
For someone moving in now, Midlothian offers a predominantly White and native-born community that is slowly becoming more Hispanic and Black, with very little Asian or immigrant presence. The city is becoming a solidly middle-class suburb with a growing industrial base, not a cosmopolitan hub. New arrivals should expect a population that values affordability, space, and a slower pace, with demographic change happening gradually rather than abruptly.
* Values derived from national, state, county, city and local statistics and may differ in a specific area. Last updated: 2026-04-19T07:11:01.000Z
Narrative content on this page is AI-generated and may contain mistakes. Verify any details that matter before acting on them.
ReloMaps may earn a commission from affiliate links at no extra cost to you.