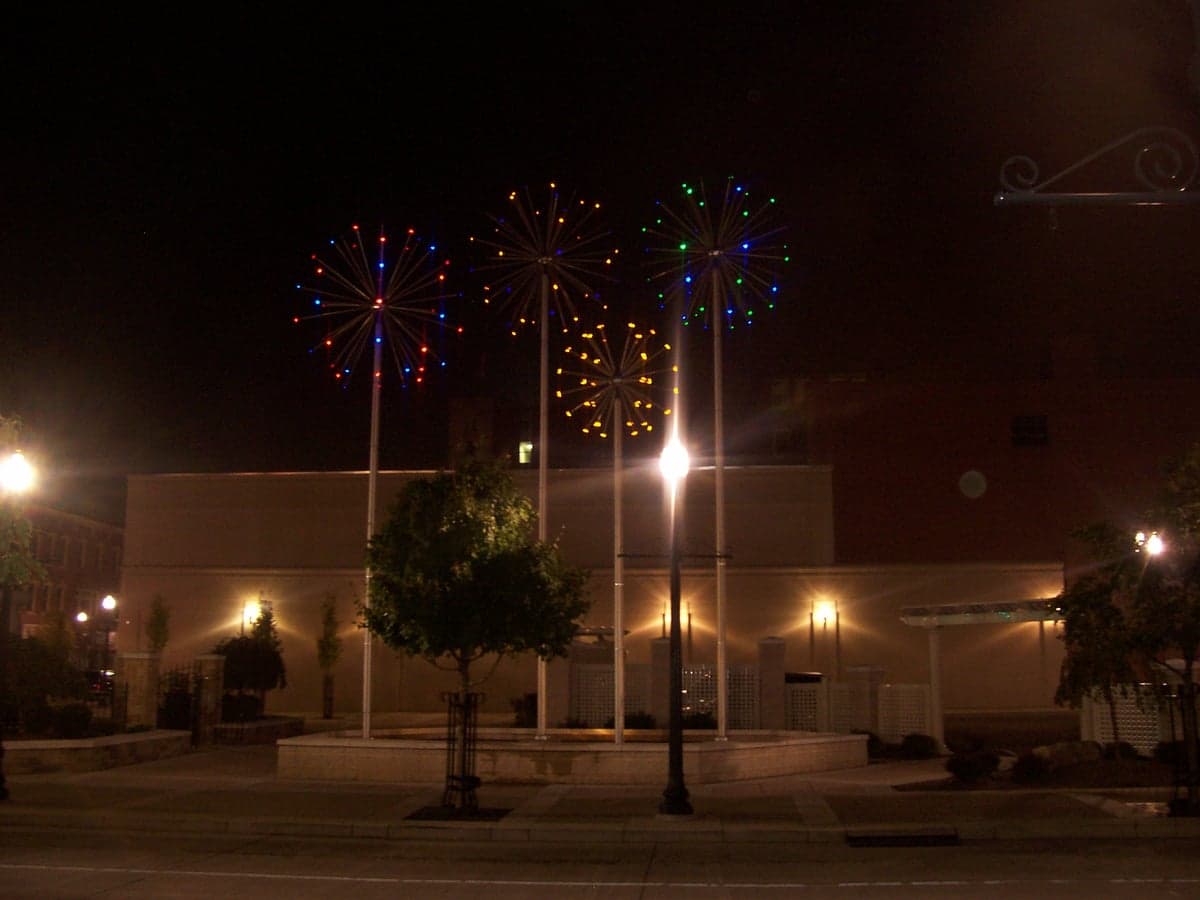
Photo: Wikipedia
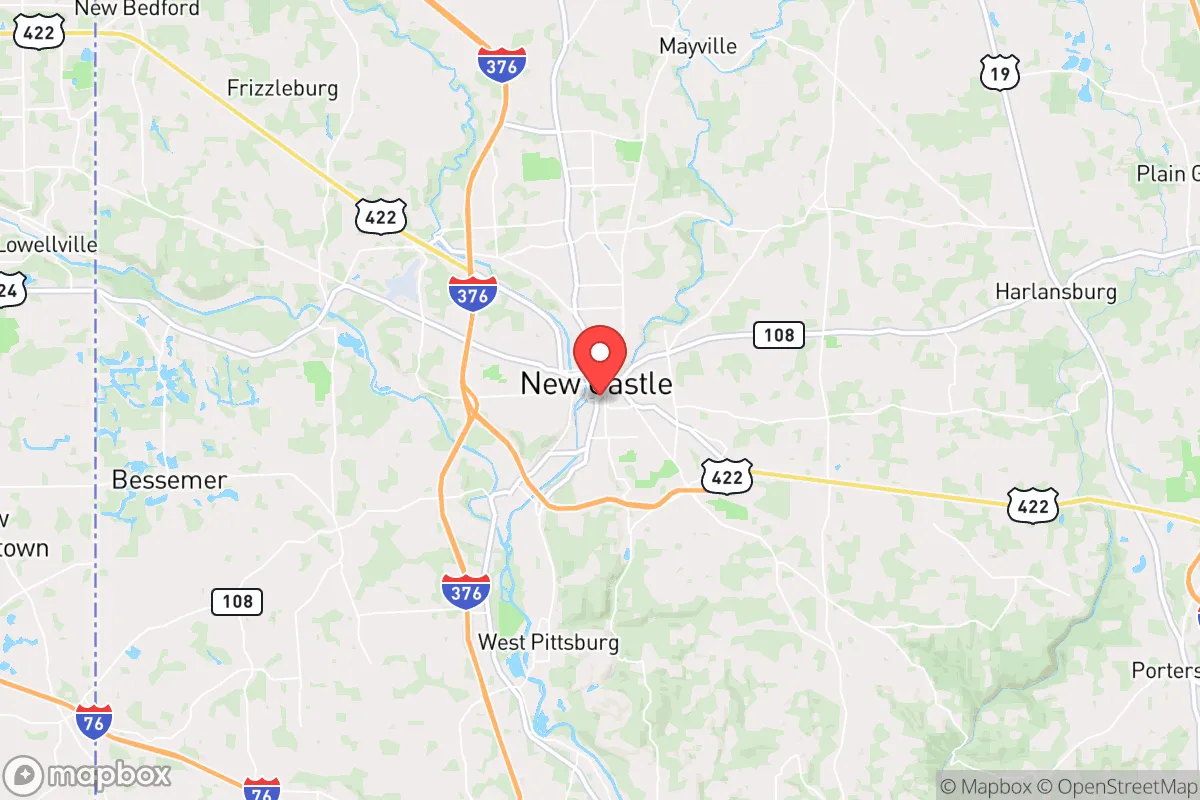
Demographics of New Castle, PA
Affluence Level in New Castle, PA
A low-income area with significant economic hardship. Household wealth and educational attainment are well below national averages.
People of New Castle, PA
The people of New Castle, Pennsylvania, today form a predominantly white (75.7%), working-class community of 21,727 residents, marked by a deeply rooted local identity and a notably low foreign-born population of just 1.0%. The city’s character is shaped by its industrial past, with a population density that feels tight in the historic core and more spread out in the surrounding neighborhoods. Distinctive markers include a strong sense of place among multi-generational families, a significant Black minority (10.4%), and a small but growing Hispanic community (4.9%), all set against a backdrop of economic transition and population decline.
How the city was settled and grew
New Castle’s population history begins with its founding in 1798 by John Carlyle Stewart, who laid out the town on a tract of land at the confluence of the Shenango and Neshannock Creeks. The original settlers were primarily of Scots-Irish and German stock, drawn by the promise of fertile farmland and the strategic location along the Beaver River. The real population boom came with the discovery of iron ore and limestone in the region, and later, the arrival of the Pennsylvania Canal and the railroad in the 1830s and 1840s. This industrial transformation attracted a wave of European immigrants, particularly Irish and Italian laborers who built the canals and railroads and settled in the West Side and South Side neighborhoods, areas that remain working-class and dense today. By the late 19th and early 20th centuries, the city’s steel and tin-plate industries drew Eastern European immigrants—Poles, Slovaks, and Ukrainians—who established tight-knit communities in the East Side and around Neshannock Avenue. These groups built ethnic churches, social halls, and mutual-aid societies that defined the city’s social fabric for generations. The peak population of over 48,000 was reached in 1930, driven entirely by industrial employment.
Modern era (post-1965)
The post-1965 era brought significant demographic shifts, though not through the large-scale immigration seen in other Rust Belt cities. The 1965 Hart-Cellar Act did not dramatically increase foreign-born populations here; New Castle’s foreign-born share has remained below 2% for decades. Instead, the major change was domestic: the collapse of the steel industry in the 1970s and 1980s triggered a sustained out-migration of white families to the suburbs and other states. This exodus opened up housing in older neighborhoods like the West Side and South Side, which saw an influx of Black families moving from the rural South and other parts of Pennsylvania. The Black population grew from a small fraction to its current 10.4%, concentrated particularly in the West Side and around the Hasson Heights area. The Hispanic population, now 4.9%, began to grow more recently, primarily through domestic migration from other parts of the U.S., with a small cluster forming near East Washington Street. The city’s Asian population remains effectively zero (0.0%), and there is no measurable Indian-subcontinent community. The college-educated share is just 15.2%, reflecting the city’s historic reliance on blue-collar employment and the departure of many younger, educated residents.
The future
The population trajectory for New Castle is one of continued slow decline, with the city losing roughly 1-2% of its residents per decade since 1970. The population is homogenizing in terms of nativity—the foreign-born share is unlikely to rise significantly given the lack of economic pull factors—but it is slowly diversifying racially. The white share is gradually decreasing as older white residents age out and younger white families leave, while the Black and Hispanic shares are likely to increase modestly through domestic migration and higher birth rates. The city is not tribalizing into distinct ethnic enclaves; rather, neighborhoods like the West Side are becoming more mixed, while the East Side and Neshannock Avenue corridor remain predominantly white and older. The next 10-20 years will likely see the population stabilize around 18,000-20,000, with a slightly more diverse but still majority-white composition. The lack of significant immigration and the continued out-migration of young adults mean the city will remain a predominantly native-born, working-class community with a strong local identity.
For someone moving in now, New Castle offers a place where the population is stable in its core demographics but slowly shifting. It is a city of deep-rooted families, modest diversity, and a clear sense of its industrial past. The low cost of living and tight-knit neighborhoods appeal to those seeking affordability and community, but the population decline and limited economic opportunities mean the city is not a growth hub. It is becoming a quieter, older, and slightly more diverse version of its former self—a place for those who value history and stability over rapid change.
* Values derived from national, state, county, city and local statistics and may differ in a specific area. Last updated: 2026-05-01T09:19:43.000Z
Narrative content on this page is AI-generated and may contain mistakes. Verify any details that matter before acting on them.
ReloMaps may earn a commission from affiliate links at no extra cost to you.