 Popular
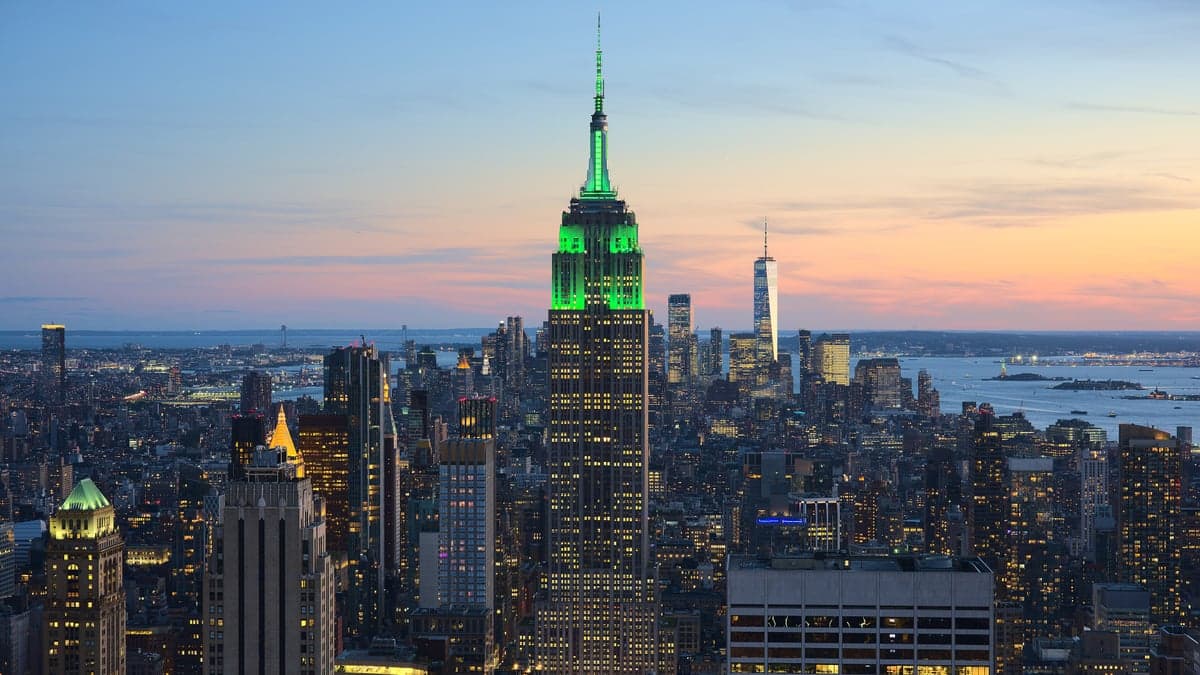
Photo: Wikipedia
Quality of Life in New York City, NY
A livable area that tracks near national norms for affordability, walkability, and neighborhood health.
What does Quality of Life tell us?
Quality of Life blends cost of living, nearby amenities, socioeconomic signals, and neighborhood character. City-level scores represent the whole municipality; individual neighborhoods can differ.
What does this tell us?
Quality of Life blends cost of living, nearby amenities, socioeconomic signals, and neighborhood character. City-level scores represent the whole municipality; individual neighborhoods can differ.
Cost of Living
98% above national average
The Real Cost of Living in New York City, NY for 2026
| Tier | Individual | Family (4) |
|---|---|---|
| Survival | $28k | $53k |
| Comfortable | $138k | $202k |
| Luxury | $144k+ | $223k+ |
| Elite (Top 5%) | $237k+ | $368k+ |
39%
The Area Signal
A metric tracking the socioeconomic signals of the area.
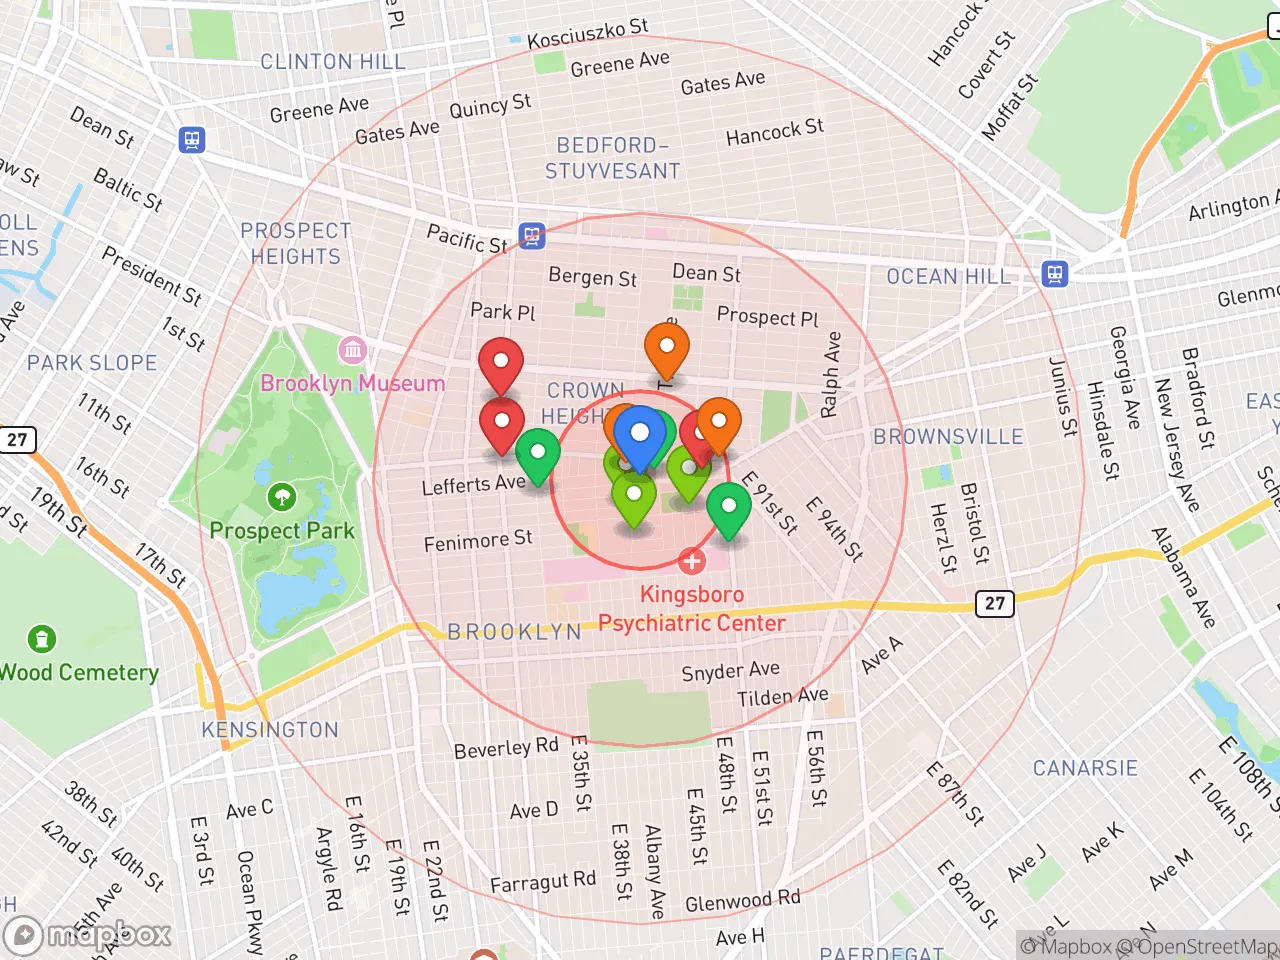
Hobbies
Explore the areaGroceries
0 within 10 miles
Gas
0 within 10 miles
Hospital
0 within 20 miles
Airport
JFK — John F. Kennedy International
Post Office
Critical Amenities
Quality-of-Life Analysis
New York City, NY, stands as one of the world's most iconic and economically powerful urban centers, drawing a uniquely diverse population of high-earning professionals, creative entrepreneurs, and ambitious newcomers. The city's median household income of approximately $76,600 reflects a broad economic spectrum, but the cost of living index of 198—nearly double the U.S. average—means that financial comfort is largely reserved for those in finance, tech, law, and media sectors. The city is home to over 8.3 million residents, with a pronounced concentration of wealth in Manhattan's core neighborhoods, while outer boroughs like Queens and the Bronx host a more mixed-income, working-class population.
Cost of living, housing affordability, and how NYC compares to nearby suburbs
Housing in New York City is the primary driver of its high cost of living, with a median home value of $751,700 and a median rent of $1,779. While the rent figure may appear moderate compared to Manhattan averages, it reflects a citywide median that includes smaller units and rent-stabilized apartments; market-rate one-bedrooms in desirable areas routinely exceed $3,000 per month. Compared to nearby suburbs like White Plains or Stamford, Connecticut, NYC offers more rental inventory but significantly higher per-square-foot costs. The average commute of 40.6 minutes is among the longest in the nation, a trade-off many residents accept for access to the city's job market and cultural density. For buyers, the property tax burden is relatively low compared to suburban New Jersey or Long Island, but co-op and condo maintenance fees can add hundreds to thousands of dollars monthly.
What daily life is like: amenities, schools, and neighborhood rhythm
Daily life in New York City is defined by its 24/7 transit system, dense walkable neighborhoods, and an unparalleled concentration of restaurants, museums, parks, and entertainment. The city's public schools, operated by the NYC Department of Education, serve over 1 million students with highly variable quality; top-tier magnet and gifted programs exist alongside underfunded district schools, driving many middle-class families to private or parochial options. Amenities such as Central Park, the High Line, and the Brooklyn Bridge Park provide essential green space, while neighborhood institutions like the New York Public Library system and community centers offer free programming. The rhythm of life is fast-paced and transactional, with residents relying heavily on bodegas, delis, and delivery services for daily needs. Noise, crowding, and occasional service disruptions on the subway are accepted as part of the city's character.
New York City is best suited for individuals who thrive in high-density, high-stimulation environments and are willing to trade space and quiet for career opportunity and cultural access. Young professionals, artists, and those in finance or media often find the city's energy and networking potential unmatched. Families with children may find the public school lottery system stressful, but those who can afford private education or live in strong school districts like parts of Staten Island or Riverdale often stay long-term. Retirees and those seeking a slower pace or lower costs are generally better served by smaller cities or suburban alternatives within the metro region.

Crime in New York City, NY
WARNING: The crime statistics are unreliable for this jurisdiction. Local authorities have either not reported or under reported their data to the FBI. This could be due to bad intentions, incompetence or technical issues. Regardless, we suggest skepticism.
Significantly higher crime rates than 76% of comparable U.S. locations.
Violent CrimeViolent Crime Analysis
Property CrimeProperty Crime Analysis
Crime Analysis
New York City’s overall safety picture is a study in contrasts: while it remains one of the safest large cities in the United States by historical standards, its current violent crime rate of 659.1 incidents per 100,000 residents is significantly higher than the national average and has been a growing concern for residents and policymakers alike. Property crime, at 2,296 per 100,000, also exceeds national benchmarks, reflecting persistent challenges in theft, burglary, and motor vehicle theft. These figures place the city in a category where careful neighborhood-level research is essential for anyone considering relocation.
Crime in context
New York City’s violent crime rate of 659.1 per 100,000 is roughly 80% higher than the national average of approximately 366 per 100,000, and well above the New York State average of about 350 per 100,000. Property crime in the city, at 2,296 per 100,000, also exceeds the national rate of roughly 1,954 per 100,000. These elevated rates are not distributed evenly across the five boroughs, but the citywide numbers reflect a system that has struggled to maintain the dramatic crime reductions seen in the 1990s and early 2000s. A key factor cited by analysts is the influence of progressive prosecutorial policies: Manhattan District Attorney Alvin Bragg and other borough DAs have implemented reforms that reduce bail requirements, decline to prosecute certain low-level offenses, and emphasize diversion programs. While these policies aim to reduce incarceration, critics argue they have contributed to a rise in recidivism and a perception that criminal behavior carries fewer consequences, particularly for quality-of-life offenses that can escalate into more serious crimes.
What residents experience
For daily life in New York City, the elevated crime rates translate into tangible concerns. Subway safety remains a top issue, with high-profile assaults and robberies making headlines even as overall transit crime has fluctuated. Residents in many neighborhoods report increased encounters with individuals experiencing homelessness or mental health crises, which can feel threatening even when not violent. Property crime is a near-constant annoyance: package theft, bicycle theft, and car break-ins are common, and many New Yorkers invest in security cameras, reinforced locks, and renters insurance as a matter of course. The city’s progressive district attorneys have been criticized for policies that release repeat offenders without bail, leading to a sense among many residents that the justice system prioritizes offender rehabilitation over public safety. This has fueled political backlash, with some local elections turning on public safety platforms and demands for more aggressive policing and prosecution.
Neighborhood-level variation is extreme. Staten Island and parts of Queens and Brooklyn (like Forest Hills or Bay Ridge) have violent crime rates well below the city average, while areas of the Bronx (such as Hunts Point or Morrisania) and northern Manhattan (Harlem, Washington Heights) see rates two to three times higher. Even within a single borough, a block-by-block difference can be dramatic. Prospective residents should consult precinct-level crime maps and consider visiting at different times of day, as the experience of safety in a quiet residential enclave of Queens is fundamentally different from that in a high-traffic commercial corridor in Midtown Manhattan.
* Values derived from national, state, county, city and local statistics and may differ in a specific area. Last updated: 2026-08-13T19:18:24.000Z
Narrative content on this page is AI-generated and may contain mistakes. Verify any details that matter before acting on them.
ReloMaps may earn a commission from affiliate links at no extra cost to you.

