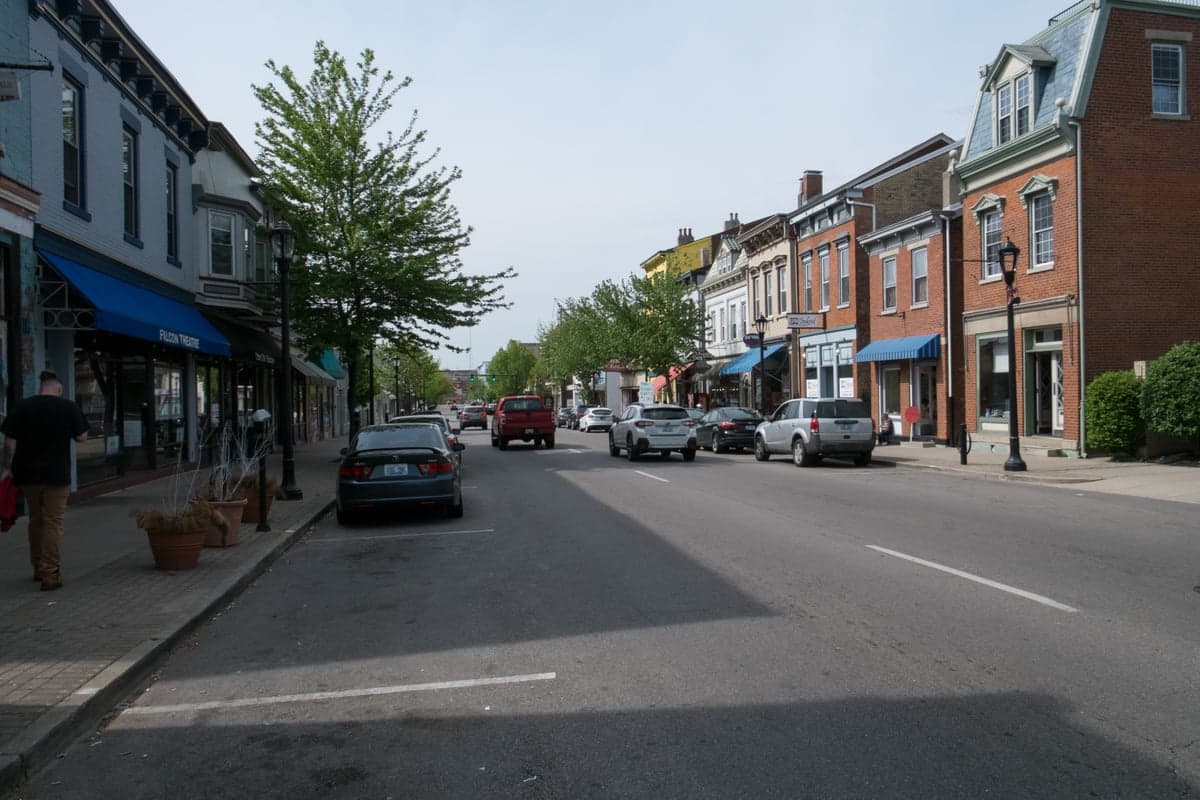
Photo: Wikipedia
Quality of Life in Newport, KY
A high quality of life with strong walkability, manageable living costs, healthy neighborhood signals, and solid amenity access.
What does Quality of Life tell us?
Quality of Life blends cost of living, nearby amenities, socioeconomic signals, and neighborhood character. City-level scores represent the whole municipality; individual neighborhoods can differ.
What does this tell us?
Quality of Life blends cost of living, nearby amenities, socioeconomic signals, and neighborhood character. City-level scores represent the whole municipality; individual neighborhoods can differ.
Cost of Living
17% below national average
The Real Cost of Living in Newport, KY for 2026
| Tier | Individual | Family (4) |
|---|---|---|
| Survival | $16k | $30k |
| Comfortable | $43k | $63k |
| Luxury | $106k+ | $164k+ |
| Elite (Top 5%) | $166k+ | $257k+ |
93%
The Area Signal
A metric tracking the socioeconomic signals of the area.
Hobbies
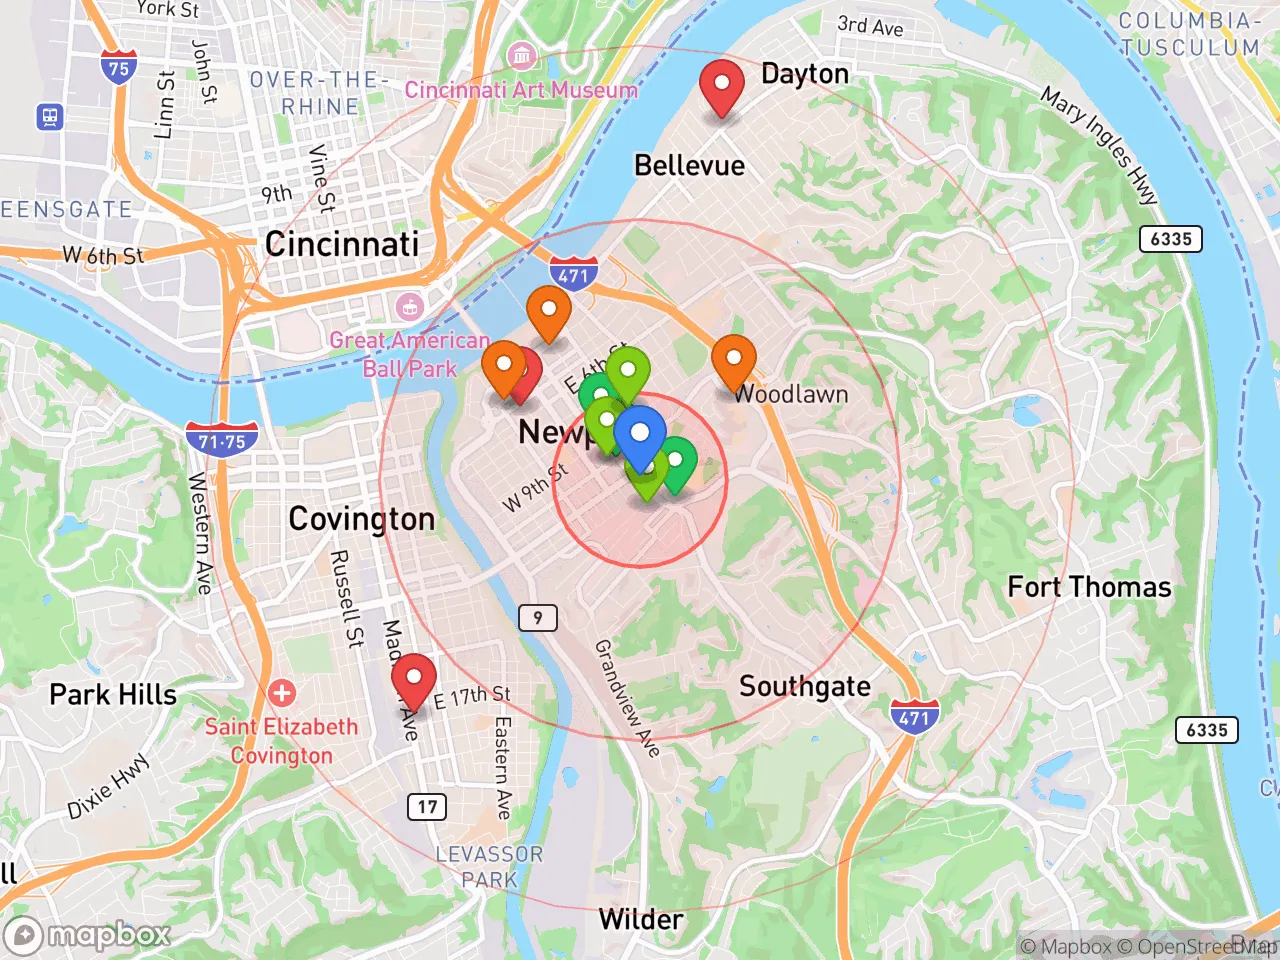
Explore the areaGroceries
5 within 10 miles
Gas
20 within 10 miles
Hospital
20 within 20 miles
Airport
John Glenn Columbus International Airport
Post Office
USPS — Newport, KY
Critical Amenities
Quality-of-Life Analysis
Newport, Kentucky, offers a quality of life defined by historic charm and relative affordability, attracting a mix of young professionals, families, and long-term residents drawn to its walkable riverfront and proximity to Cincinnati. With a cost of living index of 83—17 points below the national average—the city provides a financial buffer that is increasingly rare in the Greater Cincinnati metro area. The median home value of $221,100 and median rent of $994 position Newport as a more accessible alternative to its Ohio neighbor, where comparable properties often command premiums of 20-30%.
How Newport's cost of living and housing compare to Cincinnati and Covington
Newport’s housing market is a primary driver of its affordability. The median home value of $221,100 is roughly 15% lower than Cincinnati’s median and significantly undercuts the national median of $350,000. Renters also benefit, with a median rent of $994—well below the national average of $1,200. This cost advantage is amplified by Kentucky’s lower property tax rates compared to Ohio, though buyers should note that Kentucky taxes tangible personal property (e.g., vehicles) annually. The average commute of 21 minutes is shorter than the national average of 26 minutes, allowing residents to access jobs in Cincinnati, Covington, or Florence without enduring lengthy drives. However, Newport’s housing stock skews older, with many pre-war homes requiring renovation, which can offset upfront savings for buyers seeking move-in-ready properties.
What daily life is like for families and professionals in Newport
Daily life in Newport revolves around its compact, walkable neighborhoods and riverfront amenities. The city’s Newport on the Levee entertainment district offers dining, a movie theater, and the Newport Aquarium, while the nearby Purple People Bridge connects pedestrians to Cincinnati’s stadiums and parks. For families, Newport Independent Schools serve the city, though some residents opt for the higher-rated Fort Thomas or Beechwood districts in neighboring communities. The city’s historic East Row District features Victorian homes and tree-lined streets, fostering a strong sense of community through block parties and local events like the Newport Italian Festival. Professionals benefit from a growing tech and healthcare sector, with major employers like St. Elizabeth Healthcare and the Cincinnati/Northern Kentucky International Airport (CVG) within a 20-minute drive. The average commute of 21 minutes means most residents can reach downtown Cincinnati in under 15 minutes, avoiding the region’s worst traffic bottlenecks.
Who will thrive in Newport's current housing and lifestyle market
Newport is best suited for budget-conscious buyers and renters who prioritize urban walkability over suburban sprawl. First-time homebuyers and young professionals will find the median home value of $221,100 attainable, especially compared to Cincinnati’s $260,000 median. Families should weigh the trade-off between lower housing costs and school options, as Newport’s public schools have mixed ratings—the district’s elementary schools score above state averages, but high school performance lags behind nearby Fort Thomas. Retirees on fixed incomes will appreciate the low cost of living and access to healthcare, though the city’s nightlife and bar scene may feel less appealing to those seeking quiet. Ultimately, Newport rewards those who value historic character, short commutes, and a lower financial burden over the amenities of pricier suburbs or the density of downtown Cincinnati.
Crime in Newport, KY
Generally safer than 58% of comparable U.S. locations.
Violent CrimeViolent Crime Analysis
Property CrimeProperty Crime Analysis
Crime Analysis
Newport, Kentucky, reports a violent crime rate of 262.7 incidents per 100,000 residents and a property crime rate of 4,100.7 per 100,000, placing it in a challenging safety position relative to national benchmarks. While the violent crime figure is slightly below the U.S. average of roughly 380 per 100,000, the property crime rate is nearly double the national median, signaling a significant risk for theft, burglary, and vehicle-related offenses. As a small city adjacent to Cincinnati, Newport's crime dynamics are heavily influenced by its proximity to a major metro area and the broader criminal justice policies of Campbell County and northern Kentucky.
Crime in context
Newport's violent crime rate of 262.7 per 100,000 is lower than Kentucky's statewide average of approximately 280 per 100,000 and well below the national rate. However, the property crime rate of 4,100.7 per 100,000 is roughly 80% higher than the national average and significantly exceeds the Kentucky state average of about 2,100 per 100,000. This disparity suggests that while serious violent offenses like homicide and aggravated assault are less common, property crimes—including larceny-theft, motor vehicle theft, and burglary—are pervasive. The city's location as a border community with easy access to interstate highways (I-71 and I-75) may contribute to transient criminal activity, as offenders can quickly move between Ohio and Kentucky.
What residents experience
For daily life in Newport, the high property crime rate translates into a tangible risk for residents. Vehicle break-ins and thefts are frequently reported, particularly in parking lots near the Newport on the Levee entertainment district and along residential streets near Monmouth Street. Burglaries of apartments and single-family homes occur with enough regularity that many landlords require renter's insurance. The city's policing strategy, which includes a dedicated property crimes unit, has had mixed results; clearance rates for theft remain low due to limited forensic evidence and the transient nature of offenders. Residents often report feeling safe walking in well-lit, high-traffic areas during the day but express caution after dark, especially in neighborhoods with older housing stock and fewer streetlights.
Neighborhood-level variation is notable. The East Row Historic District and areas near the riverfront tend to have lower crime rates due to higher property values, active neighborhood associations, and more foot traffic. In contrast, parts of the West Side and neighborhoods along York Street experience higher concentrations of both property and drug-related offenses. Progressive criminal justice policies in Campbell County, including diversion programs and reduced sentencing for nonviolent offenders, have been cited by local law enforcement as contributing to repeat property crime, as offenders cycle through the system without extended incarceration. This ideological approach, while intended to reduce jail overcrowding, has frustrated some residents who see the same individuals committing thefts and break-ins repeatedly. For those considering relocation, a thorough review of block-level crime maps and conversations with local police precincts are strongly advised before choosing a specific address.
* Values derived from national, state, county, city and local statistics and may differ in a specific area. Last updated: 2026-04-21T09:25:21.000Z
Narrative content on this page is AI-generated and may contain mistakes. Verify any details that matter before acting on them.
ReloMaps may earn a commission from affiliate links at no extra cost to you.