Photo: Wikipedia
Demographics of Newport, KY
Affluence Level in Newport, KY
A middle-class area roughly in line with national averages across income, home values, education, and employment.
People of Newport, KY
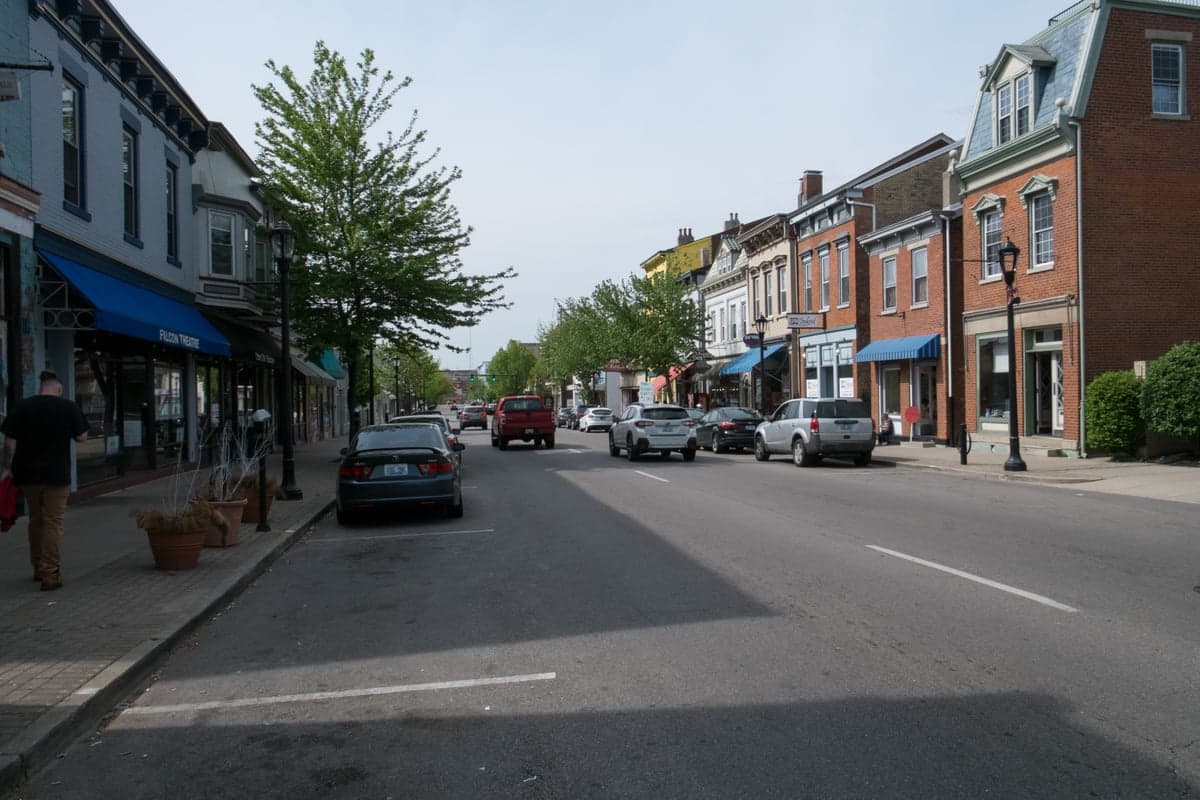
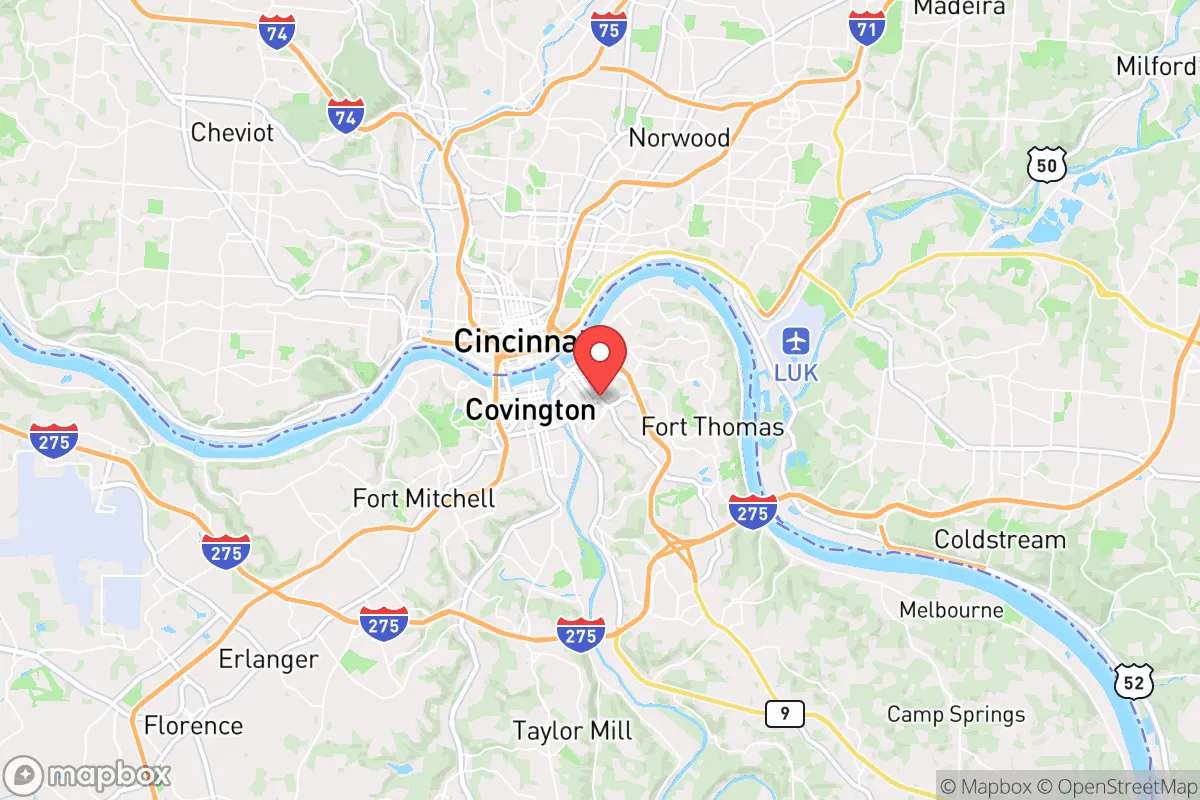
Newport, Kentucky, is a dense, historic river city of 14,039 residents that feels more like an urban neighborhood than a suburban town. Its population is predominantly White (83.6%) with a notable Hispanic minority (6.7%) and a smaller Black community (5.9%), creating a demographic profile that is less diverse than nearby Cincinnati but more varied than many of its Northern Kentucky neighbors. The city’s identity is shaped by a working-class heritage, a recent wave of riverfront redevelopment, and a population that is slightly more educated than the regional average, with 35.8% holding a college degree.
How the city was settled and grew
Newport was founded in 1795 at the confluence of the Ohio and Licking Rivers, strategically positioned as a military outpost and river port. The original settlers were largely English, Scottish, and German farmers and tradesmen drawn by land grants and the promise of river commerce. By the mid-19th century, German and Irish immigrants arrived in large numbers, building the city’s industrial base in brewing, distilling, and steamboat construction. These groups established themselves in the East Row Historic District, a neighborhood of Victorian townhomes and rowhouses that still bears their architectural imprint. A second wave of German and Italian immigrants settled in the Mansion Hill area, where they worked in the city’s thriving breweries and foundries. By 1900, Newport was a bustling industrial hub with a population exceeding 30,000, though its growth was capped by its small geographic footprint—just 3.1 square miles.
Modern era (post-1965)
The post-1965 era brought significant demographic change. The Immigration and Nationality Act of 1965 opened doors for new arrivals, but Newport’s foreign-born population remains low at just 1.9%, far below the national average. Instead, the city’s modern shifts have been driven by domestic migration. The 1970s and 1980s saw an exodus of White working-class families to suburban Boone and Kenton Counties, leaving behind a population that was older and poorer. In the 1990s and 2000s, a modest Hispanic community began to form, concentrated in the West Side neighborhoods near the Licking River, drawn by low-cost housing and service-sector jobs. The Black population, which had historically been small and centered in the Southgate Street corridor, has remained stable at around 5.9%. The most transformative recent trend has been the redevelopment of the Riverfront District, which has attracted younger, college-educated professionals—many from across the river in Cincinnati—into new condos and apartments, raising the city’s education level to 35.8% with a bachelor’s degree or higher.
The future
Newport’s population is likely to continue a slow but steady increase, driven by riverfront development and its appeal as a more affordable alternative to Cincinnati. The city is not homogenizing into a single demographic bloc; rather, it is tribalizing into distinct enclaves. The East Row Historic District and Mansion Hill remain predominantly White and increasingly affluent, while the West Side is becoming more Hispanic and working-class. The Black population is concentrated in the Southgate Street area and shows no signs of rapid growth. The foreign-born share (1.9%) is unlikely to rise dramatically, as Newport lacks the large immigrant-employer base or ethnic enclave infrastructure seen in cities like Cincinnati or Columbus. The East/Southeast Asian community (0.5%) and Indian subcontinent community (0.1%) are negligible and not forming distinct neighborhoods. Over the next 10-20 years, expect the riverfront to attract more professionals and empty-nesters, while the older industrial neighborhoods will likely see continued Hispanic in-migration and a plateauing of the Black population.
For someone moving in now, Newport is becoming a city of two tracks: a revitalized, walkable riverfront for professionals and a stable, working-class interior for families and service workers. It is not a melting pot but a collection of distinct, stable neighborhoods. The city offers historic charm and urban convenience without the high costs or intense diversity of Cincinnati, making it a practical choice for those who value affordability and a strong sense of place over demographic dynamism.
* Values derived from national, state, county, city and local statistics and may differ in a specific area. Last updated: 2026-04-21T09:25:21.000Z
Narrative content on this page is AI-generated and may contain mistakes. Verify any details that matter before acting on them.
ReloMaps may earn a commission from affiliate links at no extra cost to you.