Photo: Wikipedia
Quality of Life in North Las Vegas, NV
Above-average quality of iife. The area offers a reasonable cost of living, decent mobility, and a mix of neighborhood amenities.
What does Quality of Life tell us?
Quality of Life blends cost of living, nearby amenities, socioeconomic signals, and neighborhood character. City-level scores represent the whole municipality; individual neighborhoods can differ.
What does this tell us?
Quality of Life blends cost of living, nearby amenities, socioeconomic signals, and neighborhood character. City-level scores represent the whole municipality; individual neighborhoods can differ.
Cost of Living
36% above national average
The Real Cost of Living in North Las Vegas, NV for 2026
| Tier | Individual | Family (4) |
|---|---|---|
| Survival | $26k | $48k |
| Comfortable | $72k | $106k |
| Luxury | $113k+ | $176k+ |
| Elite (Top 5%) | $133k+ | $207k+ |
72%
The Area Signal
A metric tracking the socioeconomic signals of the area.
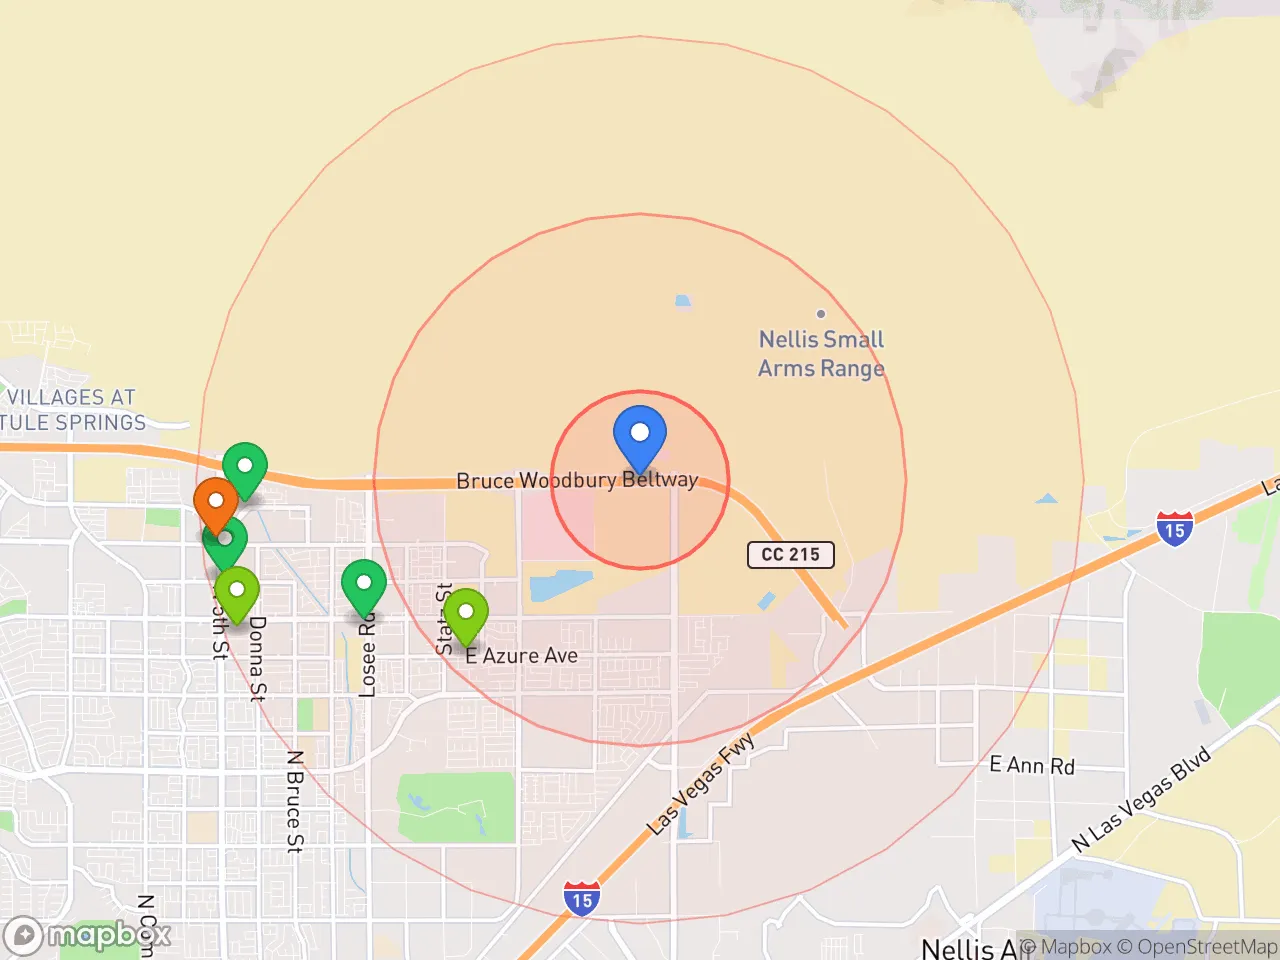
Hobbies
Explore the areaGroceries
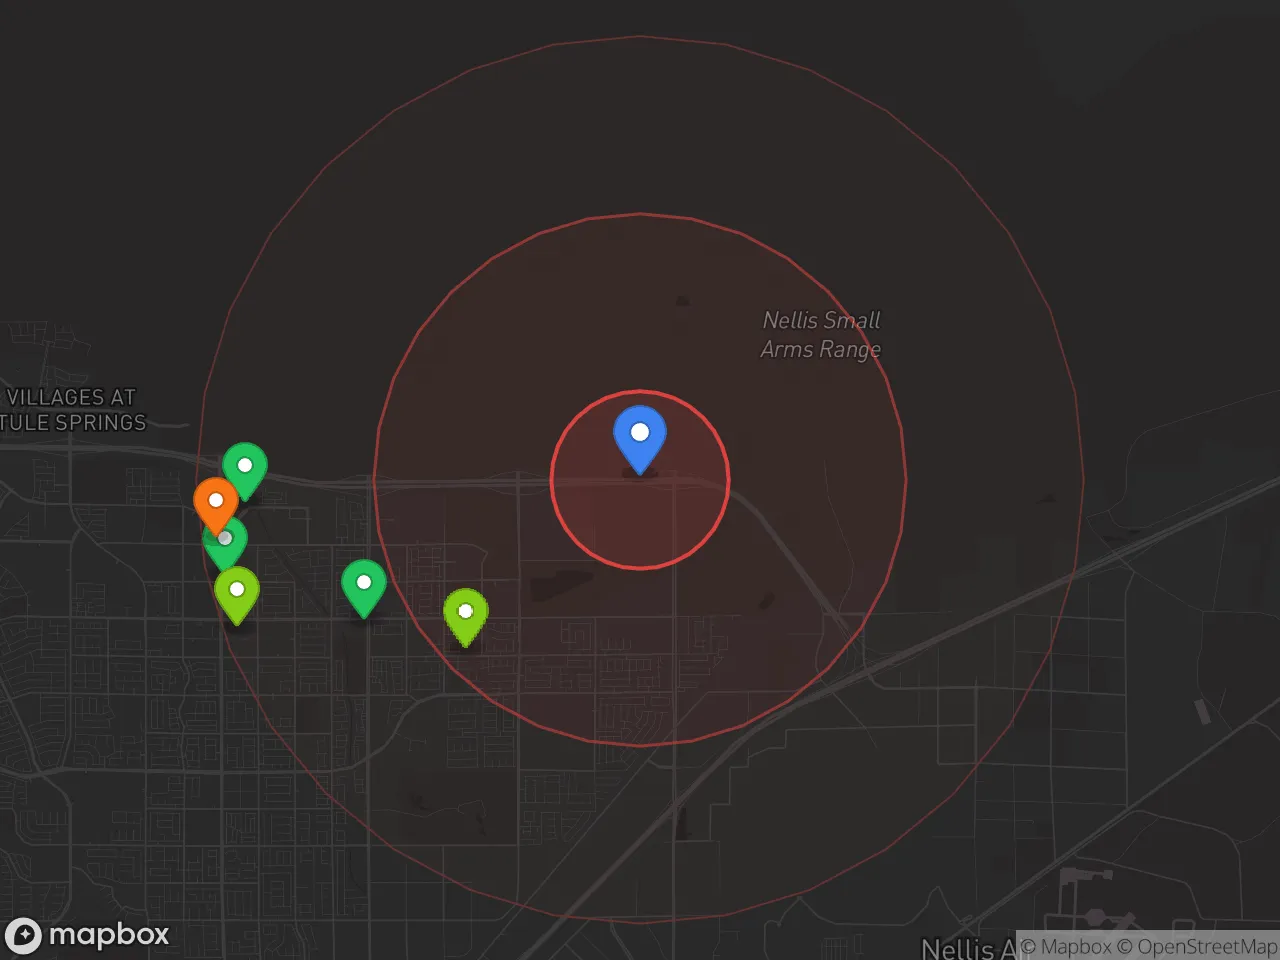
7 within 10 miles
Gas
20 within 10 miles
Hospital
20 within 20 miles
Airport
LAS — North Las Vegas
Post Office
USPS — 4250 Griffis Avenue, Nellis
Critical Amenities
Quality-of-Life Analysis
North Las Vegas presents a more affordable alternative within the Las Vegas Valley, with a cost of living index of 136 (36% above the national average) that is notably lower than nearby Henderson or Summerlin. The area attracts a mix of working-class families, first-time homebuyers, and long-term residents seeking relative value in a region known for tourism-driven economics. While not as affluent as its southern neighbors, North Las Vegas offers a distinct suburban character with a growing population of over 270,000 residents.
Cost of living and housing affordability compared to Henderson and Summerlin
Housing remains the primary driver of North Las Vegas's affordability advantage. The median home value sits at $372,300, roughly $50,000–$80,000 less than comparable homes in Henderson or Summerlin. Median rent of $1,605 is also below the Las Vegas metro average of $1,750, making it one of the more accessible rental markets in Clark County. However, the overall cost of living index of 136 reflects higher-than-average utility costs (due to summer cooling demands) and grocery prices that track with the broader metro area. Property taxes remain relatively low compared to national averages, thanks to Nevada's lack of a state income tax and a tax cap on primary residences. The average commute of 26.9 minutes is slightly longer than the Las Vegas average of 24 minutes, as many residents drive south to jobs on the Strip or in downtown Las Vegas.
Schools, parks, and daily life for families and commuters
Daily life in North Las Vegas centers on a growing network of parks and community centers, including the 120-acre Craig Ranch Regional Park with its sports fields, skate park, and walking trails. The Clark County School District operates over 40 schools in the area, though performance varies widely: Mojave High School and Cheyenne High School have below-average graduation rates (around 70–75%), while newer elementary schools like John R. Hummel Elementary score closer to state averages. For shopping and dining, the Craig Road corridor offers big-box retailers and chain restaurants, while the nearby Las Vegas North Premium Outlets provides discount shopping. Commuters rely heavily on Interstate 15 and U.S. Highway 95, which can become congested during peak hours, pushing the average commute to nearly 27 minutes. The area lacks the nightlife and entertainment density of the Strip, but residents gain quieter neighborhoods and larger lot sizes compared to central Las Vegas.
North Las Vegas works best for budget-conscious homebuyers and families who prioritize square footage and yard space over proximity to luxury amenities. The city's ongoing redevelopment efforts, including the North Las Vegas City Hall and new retail centers along Centennial Parkway, signal gradual economic improvement. However, those seeking top-tier schools or a walkable urban lifestyle will find better options in Henderson or the Las Vegas Arts District. For residents willing to trade a longer commute for lower housing costs and a suburban feel, North Las Vegas offers a pragmatic entry point into the Las Vegas housing market.
Crime in North Las Vegas, NV
Higher crime rates than 59% of comparable U.S. locations.
Violent CrimeViolent Crime Analysis
Property CrimeProperty Crime Analysis
Crime Analysis
North Las Vegas, Nevada, presents a mixed safety picture that demands careful consideration from potential residents. While the city has seen some improvements in recent years, its violent crime rate of 339.7 incidents per 100,000 residents and property crime rate of 1,545.2 per 100,000 place it well above national averages, a reality shaped in part by the broader Clark County justice system's progressive policies.
Crime in context
North Las Vegas's violent crime rate is roughly 15% higher than the national average of approximately 295 per 100,000, while its property crime rate exceeds the U.S. median by about 20%. These figures are also elevated compared to Nevada's statewide averages, which themselves are above national norms. The city's proximity to Las Vegas and its role as a more affordable residential alternative mean it absorbs spillover crime from the larger metro area. A key factor compounding these numbers is the influence of progressive district attorneys and judges in Clark County, who have implemented policies such as reduced cash bail, diversion programs for repeat offenders, and lighter sentencing guidelines. While intended to reduce incarceration, these approaches have been linked to higher recidivism rates and a perception that property and violent crimes carry fewer consequences, emboldening offenders and undermining public safety.
What residents experience
For those living in North Las Vegas, the statistical reality translates into tangible daily concerns. Property crime—including vehicle theft, burglary, and larceny—is the most common issue, with residents frequently reporting stolen packages, broken car windows, and home break-ins. Violent crime, while less frequent, is concentrated in specific areas and often tied to gang activity or domestic disputes. The progressive justice environment means that even when arrests are made, offenders may be released quickly or face minimal jail time, creating a cycle where victims feel the system prioritizes offender rehabilitation over their own security. This is particularly frustrating for homeowners and small business owners who invest in security systems and neighborhood watch programs, only to see repeat offenders return to the same streets.
Neighborhood-level variation is significant. Areas west of I-15, such as the Aliante master-planned community, tend to have lower crime rates due to higher property values, gated access, and active homeowners associations. In contrast, older neighborhoods east of I-15, particularly around the Cheyenne Avenue corridor and near the Las Vegas Motor Speedway, experience higher concentrations of both property and violent crime. The city's police department has increased patrols and community outreach in these hotspots, but the broader judicial climate limits long-term deterrence. Prospective residents should research specific ZIP codes—89131 and 89084 generally fare better, while 89030 and 89032 warrant extra caution—and consider that even in safer pockets, the city's overall crime profile is a direct consequence of a lenient legal system that prioritizes offender outcomes over victim protection.
* Values derived from national, state, county, city and local statistics and may differ in a specific area. Last updated: 2026-04-23T04:09:41.000Z
Narrative content on this page is AI-generated and may contain mistakes. Verify any details that matter before acting on them.
ReloMaps may earn a commission from affiliate links at no extra cost to you.