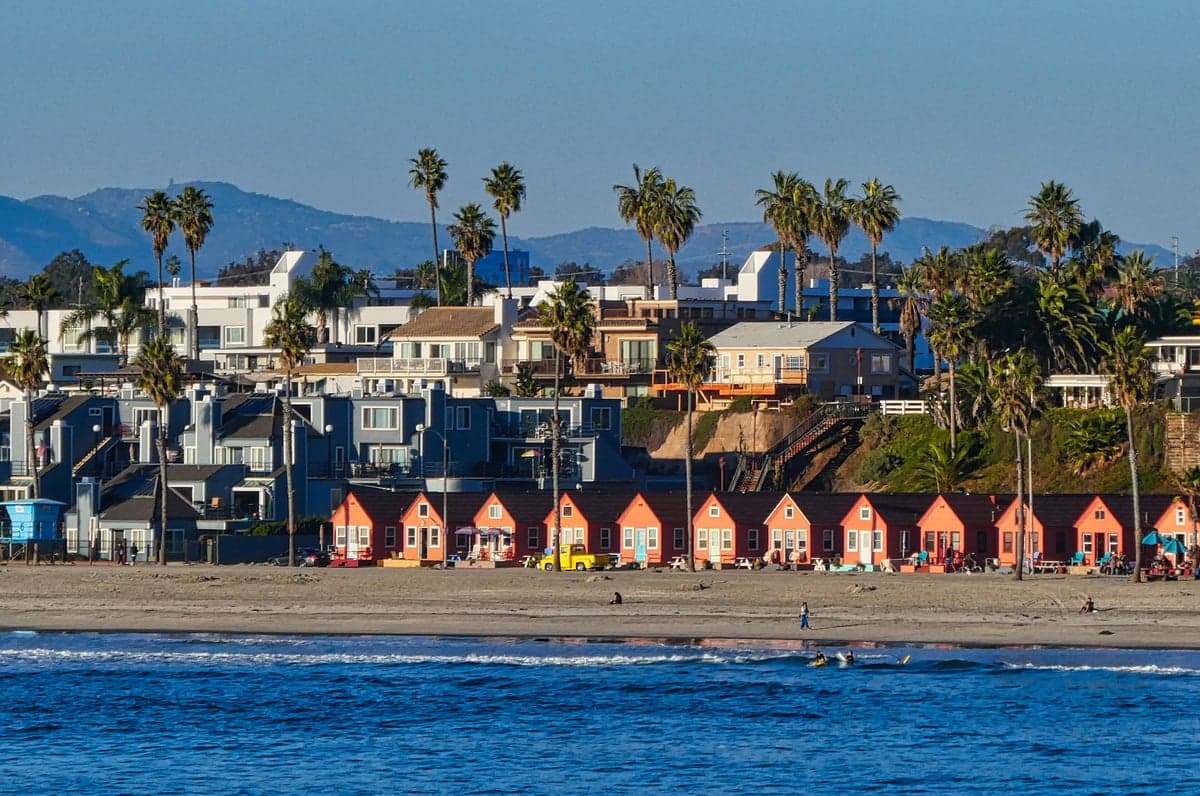
Photo: Wikipedia
Quality of Life in Oceanside, CA
A high quality of life with strong walkability, manageable living costs, healthy neighborhood signals, and solid amenity access.
What does Quality of Life tell us?
Quality of Life blends cost of living, nearby amenities, socioeconomic signals, and neighborhood character. City-level scores represent the whole municipality; individual neighborhoods can differ.
What does this tell us?
Quality of Life blends cost of living, nearby amenities, socioeconomic signals, and neighborhood character. City-level scores represent the whole municipality; individual neighborhoods can differ.
Cost of Living
113% above national average
The Real Cost of Living in Oceanside, CA for 2026
| Tier | Individual | Family (4) |
|---|---|---|
| Survival | $35k | $66k |
| Comfortable | $101k | $149k |
| Luxury | $149k+ | $231k+ |
| Elite (Top 5%) | $175k+ | $271k+ |
63%
The Area Signal
A metric tracking the socioeconomic signals of the area.
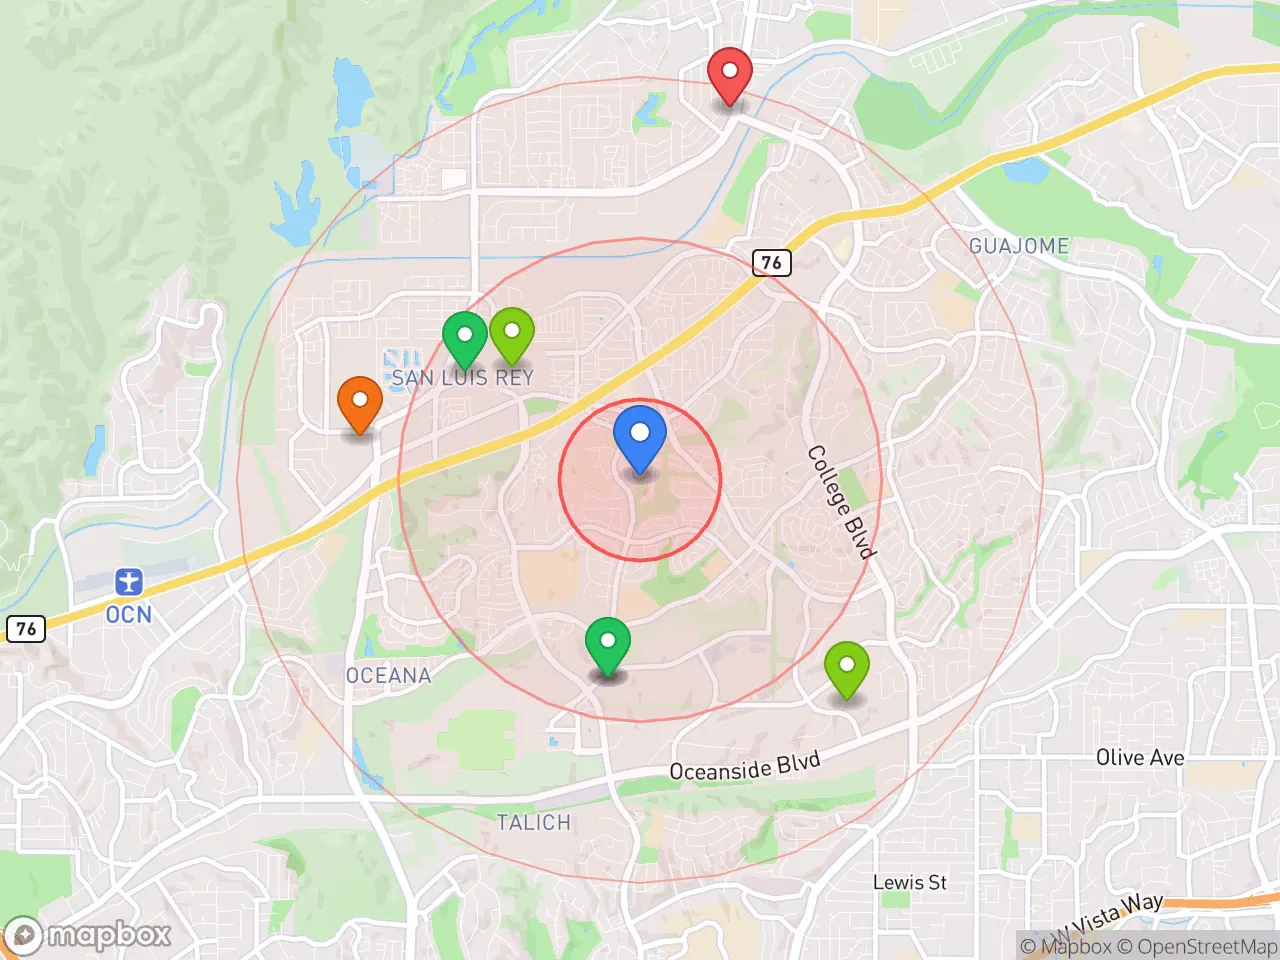
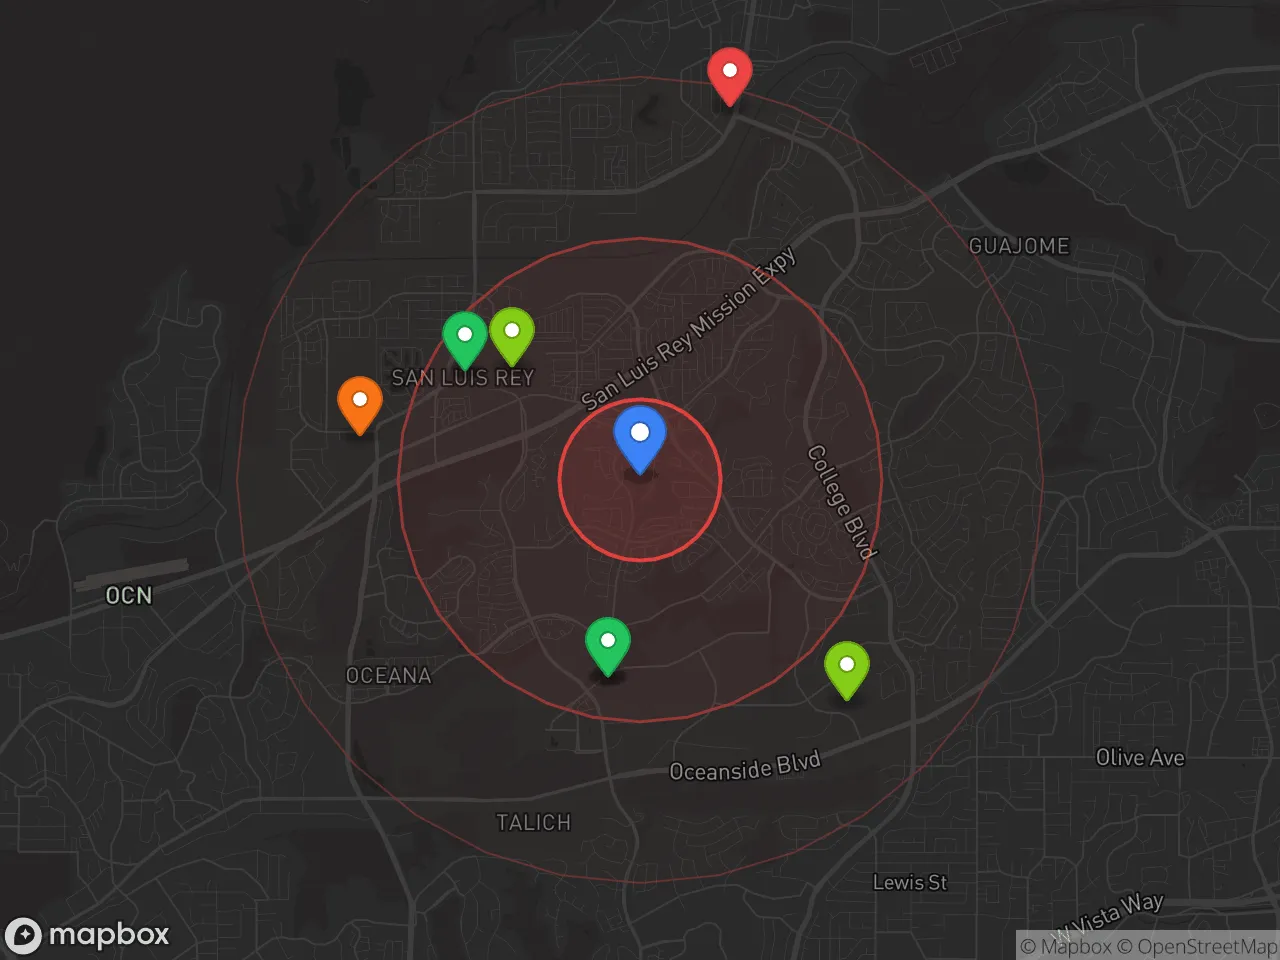
Hobbies
Explore the areaGroceries
9 within 10 miles
Gas
20 within 10 miles
Hospital
7 within 20 miles
Airport
SAN — San Diego International
Post Office
USPS — Oceanside, CA
Critical Amenities
Quality-of-Life Analysis
Oceanside, California, presents a quality-of-life profile defined by its coastal location and a cost of living index of 213—more than double the national average—which shapes a community of middle-to-upper-income professionals, military families tied to nearby Camp Pendleton, and long-term residents who value beach access over urban density. The city's population of roughly 175,000 includes a significant mix of commuters to San Diego and Orange County, along with a growing number of remote workers drawn by the climate. While Oceanside is less affluent than neighboring Carlsbad or Encinitas, its median household income of approximately $72,000 reflects a more economically diverse base than many other North County coastal cities.
Cost of living, housing, and affordability compared to nearby cities
Oceanside's cost of living index of 213 is driven primarily by housing, with a median home value of $702,000 and a median rent of $2,207—both significantly lower than Carlsbad (median home value ~$1.1 million) and Encinitas (~$1.3 million), but still roughly 40% above the San Diego County median. For renters, the average two-bedroom apartment in Oceanside costs about $2,600, compared to $3,200 in Carlsbad, making it one of the more attainable coastal options in the region. The average commute of 29.5 minutes is slightly longer than the county average of 27 minutes, reflecting the many residents who travel south to jobs in San Diego or north to Camp Pendleton and Orange County. Property taxes in Oceanside are capped at 1% of assessed value under California's Proposition 13, but overall housing costs still consume roughly 35-40% of median household income, pushing affordability to the edge for many families.
Amenities, schools, and what daily life feels like for families
Daily life in Oceanside centers on its 3.5-mile coastline, with the Oceanside Pier and Harbor Beach providing free public access, and the Oceanside Marina offering boat rentals and dining. The city's school system, Oceanside Unified School District, serves about 16,000 students with a graduation rate of 88%, slightly below the state average, though El Camino High School and Oceanside High School both offer International Baccalaureate programs. For families, the city's 30+ parks, the Mission San Luis Rey historic site, and the weekly Sunset Market on Pier View Way create a walkable, community-oriented rhythm. Commuters rely heavily on the Sprinter light rail and Metrolink trains to reach San Diego or Los Angeles, though most still drive. Healthcare access is solid, with Tri-City Medical Center in nearby Vista and Scripps Memorial Hospital in Encinitas both within 15 minutes. The city's crime rate is moderate—property crime runs about 10% above the national average, but violent crime is below the California state average.
Oceanside works best for people who want a genuine beach-town lifestyle without the premium price tag of Carlsbad or Del Mar, and who can tolerate a longer commute for that trade-off. Military families stationed at Camp Pendleton find the city especially practical, as do remote workers who can take advantage of the climate and lower housing costs relative to other coastal North County cities. Those seeking top-tier public schools or ultra-low crime rates may prefer Encinitas or Solana Beach, but for a balance of ocean access, diversity, and relative affordability within San Diego County, Oceanside remains a strong contender.
Crime in Oceanside, CA
Crime rates similar to the national median for U.S. locations.
Violent CrimeViolent Crime Analysis
Property CrimeProperty Crime Analysis
Crime Analysis
Oceanside, California, presents a mixed safety picture for potential residents. While the city offers desirable coastal living, its crime rates are a significant concern, particularly when viewed through the lens of San Diego County’s broader progressive justice system. With a violent crime rate of 380.2 per 100,000 residents and a property crime rate of 1,532.6 per 100,000, Oceanside’s numbers exceed both state and national averages, a reality that demands careful consideration from anyone planning a move.
Crime in context
Oceanside’s violent crime rate is roughly 8% higher than the California average and about 10% higher than the national average. Property crime is similarly elevated, running approximately 15% above the state rate and 20% above the national figure. These statistics place Oceanside in a challenging position compared to other mid-sized coastal cities in Southern California. The city’s proximity to Camp Pendleton and its role as a transit hub for the region contribute to transient populations that can strain local law enforcement. More critically, the progressive policies of the San Diego County District Attorney’s office, which emphasize diversion programs and reduced sentencing for many non-violent and some violent offenses, mean that repeat offenders cycle back onto the streets more quickly than in jurisdictions with tougher prosecutorial approaches. This directly impacts public safety by increasing the likelihood of recidivism.
What residents experience
For those living in Oceanside, the most tangible safety concerns revolve around property crime. Vehicle break-ins, package thefts, and residential burglaries are common complaints, particularly in neighborhoods near the beach and major transit corridors like Interstate 5. Violent crime, while less frequent, is concentrated in specific areas and often involves gang-related activity or disputes among individuals known to each other. Residents report that the visible presence of homeless encampments, especially along the San Luis Rey Riverbed and near the Oceanside Transit Center, contributes to a sense of unease and is linked to higher rates of petty theft and public intoxication. The city’s police department is responsive, but the broader judicial environment—where judges and the DA prioritize rehabilitation over incarceration—means that many arrested individuals face minimal consequences, undermining deterrence and frustrating community members who want to see tougher enforcement.
Neighborhood-level safety varies considerably. The areas south of Mission Avenue and west of Interstate 5, including the historic downtown and beachfront, see higher foot traffic and police patrols but also experience more property crime. The eastern neighborhoods, such as those around Rancho Del Oro and the inland hills, generally report lower crime rates and are considered safer for families. The area immediately surrounding the Oceanside Pier and the harbor can feel less secure after dark due to transient activity. Prospective residents should research specific blocks and talk to local homeowners’ associations, as the difference between a quiet cul-de-sac and a high-crime corridor can be just a few streets. Given the progressive justice policies in place, choosing a neighborhood with strong community watch programs and private security measures is a practical step for mitigating risk.
* Values derived from national, state, county, city and local statistics and may differ in a specific area. Last updated: 2026-04-24T14:29:58.000Z
Narrative content on this page is AI-generated and may contain mistakes. Verify any details that matter before acting on them.
ReloMaps may earn a commission from affiliate links at no extra cost to you.