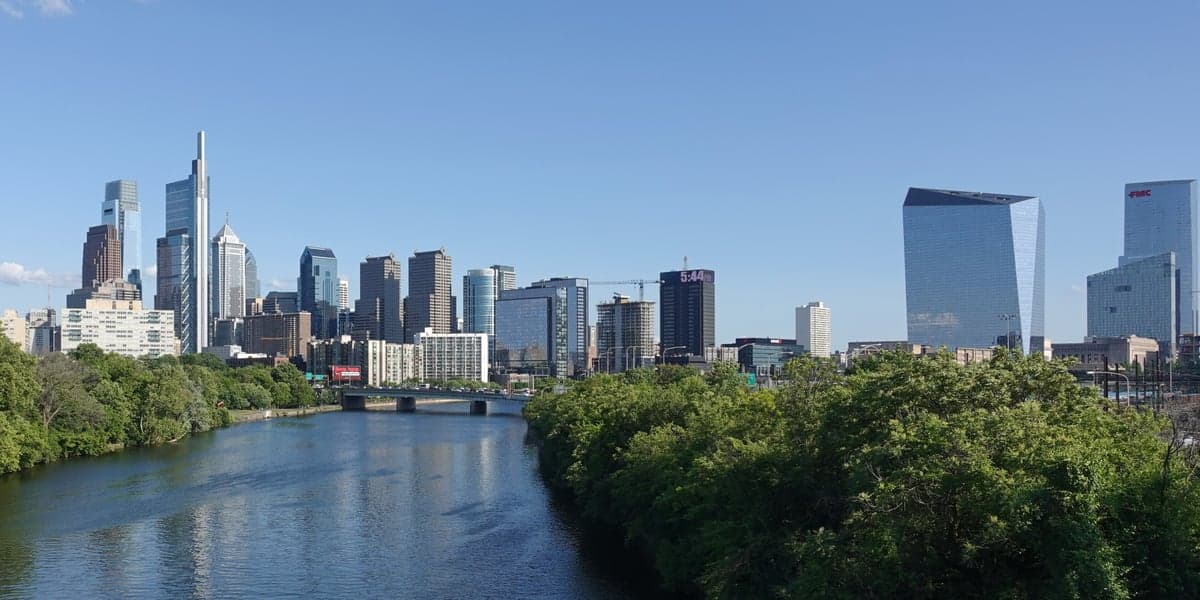

Photo: Wikipedia
Quality of Life in Philadelphia, PA
Above-average quality of iife. The area offers a reasonable cost of living, decent mobility, and a mix of neighborhood amenities.
What does Quality of Life tell us?
Quality of Life blends cost of living, nearby amenities, socioeconomic signals, and neighborhood character. City-level scores represent the whole municipality; individual neighborhoods can differ.
What does this tell us?
Quality of Life blends cost of living, nearby amenities, socioeconomic signals, and neighborhood character. City-level scores represent the whole municipality; individual neighborhoods can differ.
Cost of Living
1% above national average
The Real Cost of Living in Philadelphia, PA for 2026
| Tier | Individual | Family (4) |
|---|---|---|
| Survival | $21k | $40k |
| Comfortable | $45k | $66k |
| Luxury | $110k+ | $170k+ |
| Elite (Top 5%) | $154k+ | $238k+ |
91%
The Area Signal
A metric tracking the socioeconomic signals of the area.
Hobbies
Explore the areaGroceries
7 within 10 miles
Gas
20 within 10 miles
Hospital
20 within 20 miles
Airport
PHL — Philadelphia International
Post Office
USPS — Philadelphia, PA
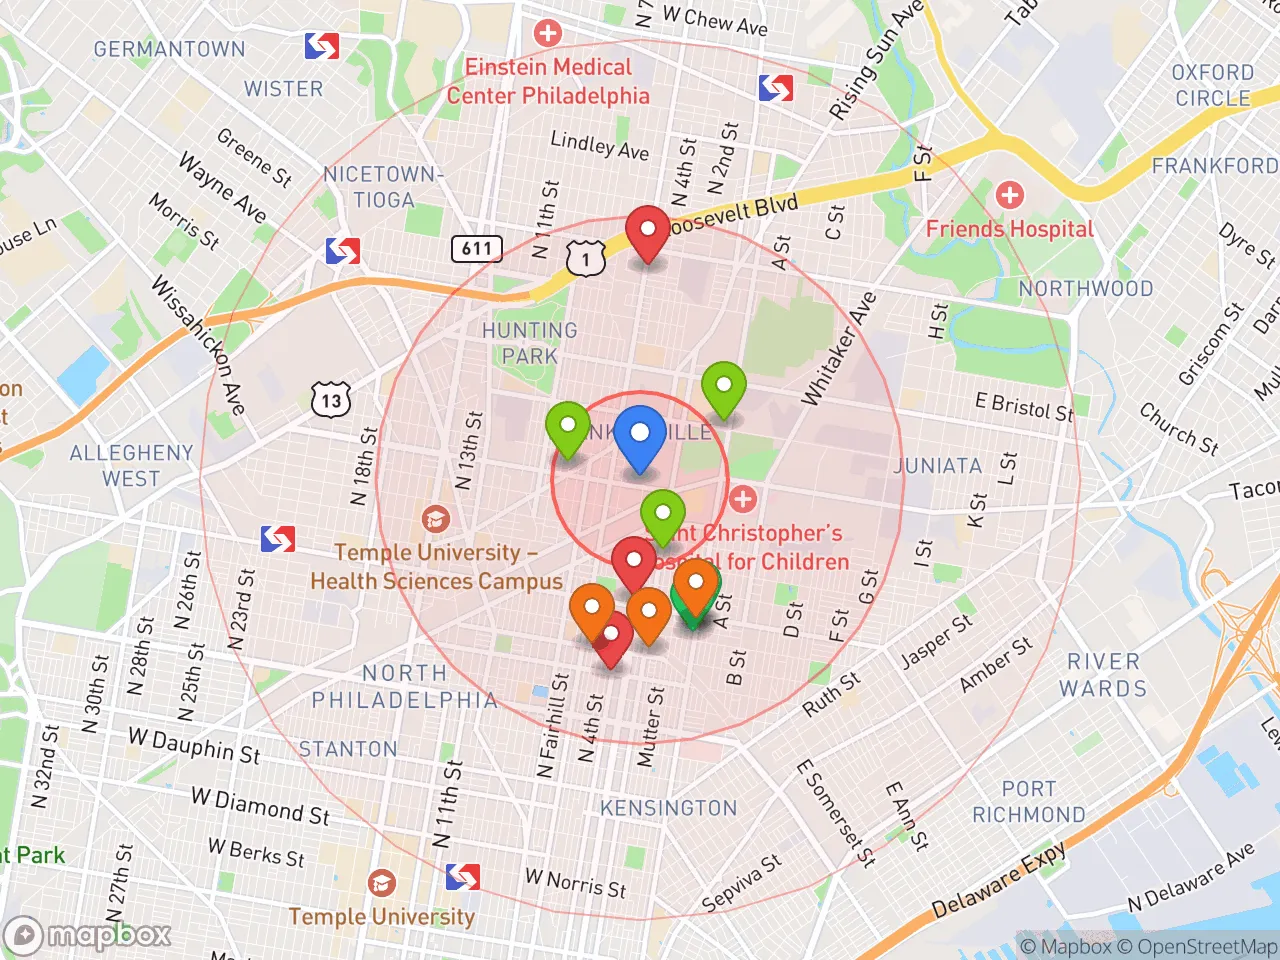
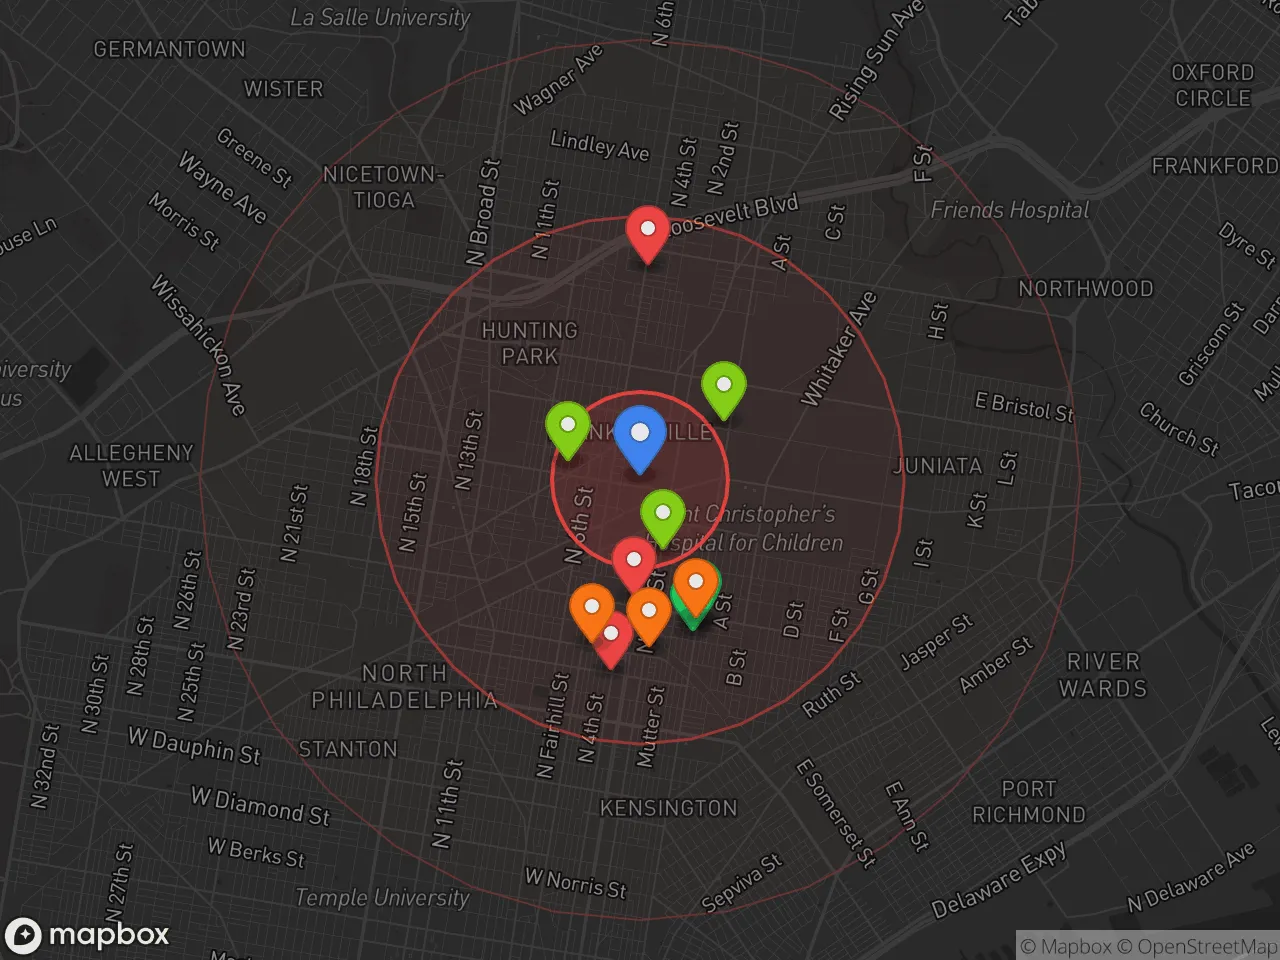
Critical Amenities
Quality-of-Life Analysis
Philadelphia presents a quality-of-life profile that is distinctly urban and economically accessible compared to the broader Northeast corridor, with a cost-of-living index of 101 (on par with the U.S. average) that stands in sharp contrast to the extreme expense of nearby New York City (index ~187) or Washington, D.C. (index ~152). The city's population of roughly 1.6 million is a dense mix of longtime working-class families, young professionals drawn by the job market in healthcare and education, and students from over 20 colleges and universities. Affluence is unevenly distributed—pockets like Center City and Rittenhouse Square boast high incomes and luxury amenities, while many neighborhoods in North and West Philadelphia face poverty rates above 25%—making the city a place of stark contrasts rather than uniform prosperity.
Cost of living, housing affordability, and how Philadelphia compares to the suburbs
Philadelphia's housing market is a major draw for cost-conscious buyers and renters. The median home value of $232,400 is roughly half the national median of $420,000 and dramatically lower than the Philadelphia suburbs (e.g., Main Line communities like Bryn Mawr average over $600,000). The median rent of $1,323 is also below the national average of $1,700, though it has risen 18% since 2020. For context, renting in nearby New York City costs more than double that figure. However, the trade-off is a median commute of 32 minutes—longer than the national average of 27 minutes—driven by heavy reliance on SEPTA's regional rail and bus system, which can be unreliable during off-peak hours. Property taxes in Philadelphia average 1.4% of assessed value, slightly higher than the national average but lower than in many New Jersey suburbs (often 2%+). Overall, the city offers a rare combination of urban density and below-average housing costs, though wages in sectors like retail and hospitality have not kept pace with rising rents.
What daily life is like for families, amenities, and school quality
Daily life in Philadelphia is defined by walkable neighborhoods, a robust public transit network, and a calendar of cultural events that rivals any U.S. city. The School District of Philadelphia has improved graduation rates to 74% (up from 63% in 2015), but only 23% of students score proficient in reading on state tests, pushing many families toward charter schools or private options like Friends Select School ($40,000/year). Amenities are a strong point: the city boasts over 400 parks, including Fairmount Park (2,000+ acres), the Philadelphia Museum of Art, and a food scene anchored by Reading Terminal Market and hundreds of BYOB restaurants. The average commute time of 32 minutes means many residents spend over an hour daily on transit, but the compact layout of Center City makes errands walkable. Crime remains a concern—the city recorded 410 homicides in 2024, down from 562 in 2021 but still high compared to peer cities like Boston (60 homicides). Most violent crime is concentrated in specific neighborhoods (e.g., Kensington, parts of North Philly), while areas like University City and Fairmount are relatively safe.
Philadelphia is best suited for people who value cultural density, walkable urbanism, and housing affordability over suburban space and top-tier public schools. Young professionals in healthcare (the city's largest employer is the University of Pennsylvania Health System, with 48,000 workers) and creative industries will find a vibrant social scene and reasonable rents. Families should weigh the school challenges carefully—many opt for private or charter schools—but the city's museums, libraries, and parks offer rich enrichment. Retirees on fixed incomes can stretch their dollars further here than in most East Coast cities, though the 32-minute average commute and occasional transit delays may frustrate those who prefer driving. Ultimately, Philadelphia rewards those who embrace its gritty, historic, and deeply communal character—it is not a place for those seeking pristine suburbs or low-crime tranquility, but for those who want an authentic, affordable, and endlessly interesting urban experience.
Crime in Philadelphia, PA
WARNING: The crime statistics are unreliable for this jurisdiction. Local authorities have either not reported or under reported their data to the FBI. This could be due to bad intentions, incompetence or technical issues. Regardless, we suggest skepticism.
Significantly higher crime rates than 91% of comparable U.S. locations.
Violent CrimeViolent Crime Analysis
Property CrimeProperty Crime Analysis
Crime Analysis
Philadelphia’s overall safety picture is deeply concerning, with violent crime rates far exceeding both state and national averages. The city recorded a violent crime rate of 821.6 incidents per 100,000 residents, a figure that is roughly three times the national average and significantly higher than the Pennsylvania state average. Property crime is also a major issue, with a rate of 4,342.7 per 100,000, well above the national benchmark. These statistics place Philadelphia among the most dangerous large cities in the United States, a reality driven in part by the progressive policies of local elected officials.
Crime in context
Philadelphia’s violent crime rate of 821.6 per 100,000 is more than double the national average of roughly 380 per 100,000 and far exceeds the Pennsylvania state average of approximately 300 per 100,000. Property crime, at 4,342.7 per 100,000, also dwarfs the national average of around 2,000 per 100,000. These numbers reflect a systemic failure in public safety. The city’s progressive district attorney, Larry Krasner, has implemented policies that prioritize reducing incarceration and diverting offenders from prosecution, which critics argue has directly emboldened criminals and reduced accountability. The result is a justice system that, while sympathetic to offenders, negatively impacts victims and the general public by leaving more criminals on the street.
What residents experience
For residents, the high crime rates translate into a daily reality of heightened vigilance and risk. Violent crimes, including homicides, aggravated assaults, and robberies, are concentrated in certain neighborhoods but can occur anywhere. Property crimes such as burglary, theft, and motor vehicle theft are pervasive, with car break-ins and package thefts being common complaints. The progressive judicial philosophy in Philadelphia means that even when arrests are made, offenders often face lenient sentences or are released without bail, creating a revolving door that undermines deterrence. This environment erodes trust in the justice system and forces residents to invest heavily in private security measures, from alarm systems to neighborhood watch groups.
Neighborhood-level variation is stark. Areas like Center City and University City have lower crime rates due to heavy police presence and economic investment, but they are not immune to property crime. In contrast, neighborhoods such as Kensington, North Philadelphia, and parts of West Philadelphia experience extreme levels of violent crime and open-air drug markets. The disparity is so pronounced that a resident’s safety depends largely on their zip code. However, the progressive policies of the district attorney’s office apply citywide, meaning that even in safer areas, residents are affected by the broader culture of impunity. For anyone considering a move to Philadelphia, a thorough neighborhood-by-neighborhood analysis is essential, and the city’s overall trajectory under its current leadership should give serious pause.
* Values derived from national, state, county, city and local statistics and may differ in a specific area. Last updated: 2026-05-01T21:36:02.000Z
Narrative content on this page is AI-generated and may contain mistakes. Verify any details that matter before acting on them.
ReloMaps may earn a commission from affiliate links at no extra cost to you.