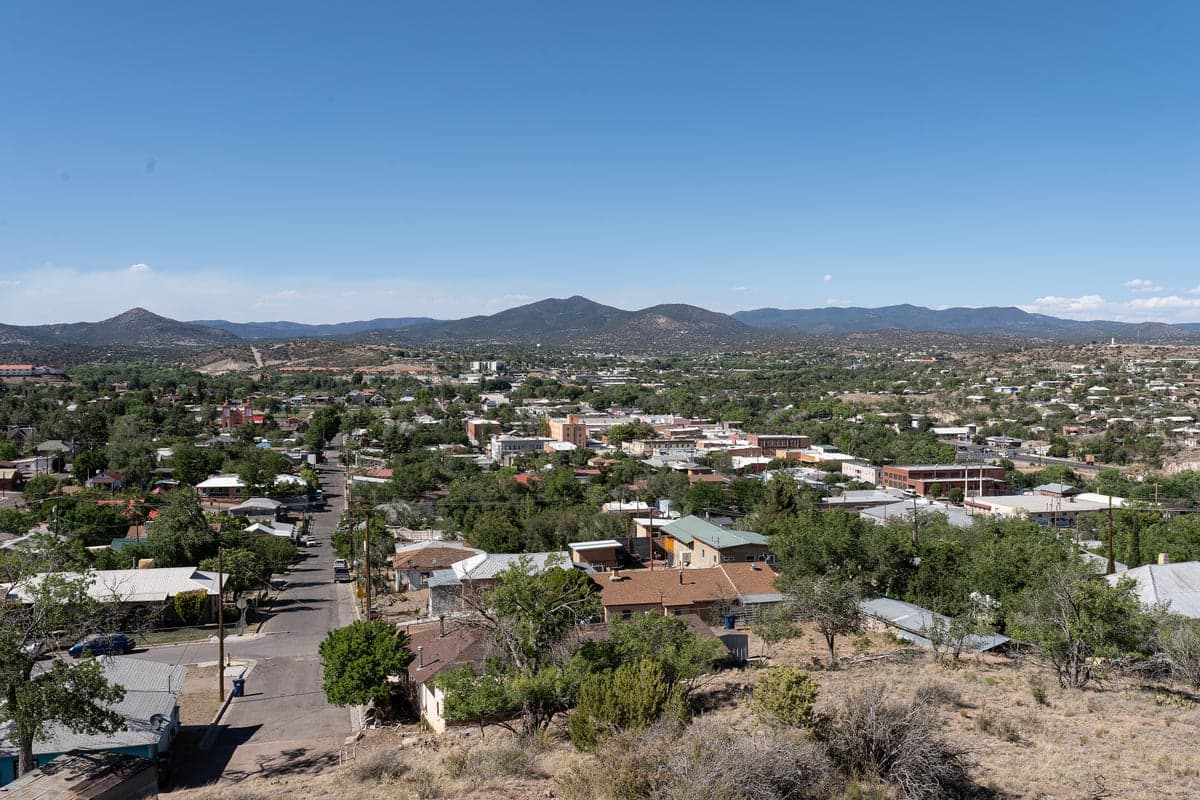
Photo: Wikipedia
Quality of Life in Silver City, NM
A high quality of life with strong walkability, manageable living costs, healthy neighborhood signals, and solid amenity access.
What does Quality of Life tell us?
Quality of Life blends cost of living, nearby amenities, socioeconomic signals, and neighborhood character. City-level scores represent the whole municipality; individual neighborhoods can differ.
What does this tell us?
Quality of Life blends cost of living, nearby amenities, socioeconomic signals, and neighborhood character. City-level scores represent the whole municipality; individual neighborhoods can differ.
Cost of Living
33% below national average
The Real Cost of Living in Silver City, NM for 2026
| Tier | Individual | Family (4) |
|---|---|---|
| Survival | $14k | $26k |
| Comfortable | $31k | $46k |
| Luxury | $70k+ | $109k+ |
| Elite (Top 5%) | $96k+ | $149k+ |
85%
The Area Signal
A metric tracking the socioeconomic signals of the area.
Hobbies
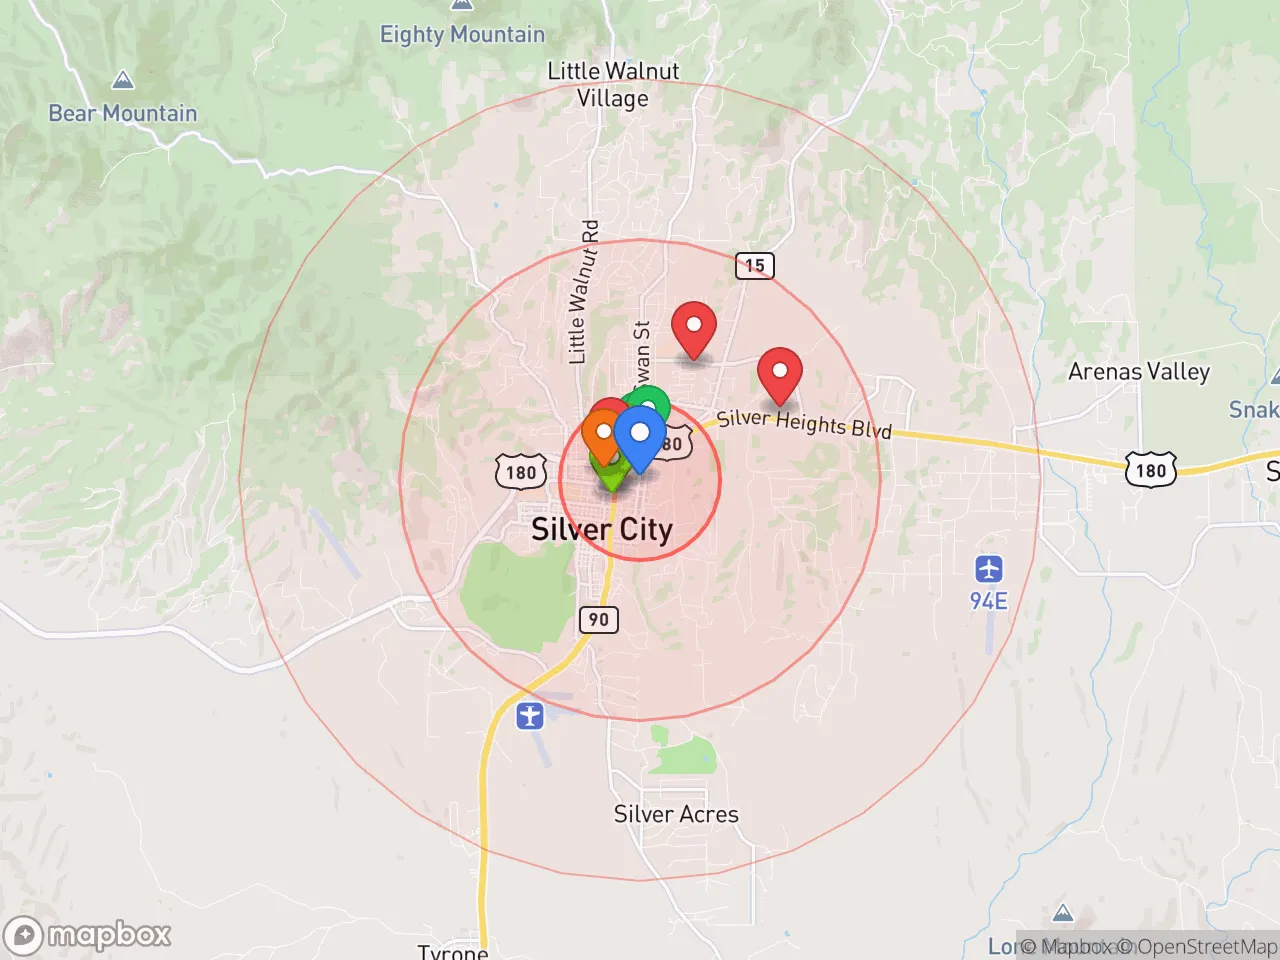
Explore the areaGroceries
1 within 10 miles
Gas
4 within 10 miles
Hospital
1 within 20 miles
Airport
LAS — Las Cruces International
Post Office
USPS — Silver City, NM
Critical Amenities
Quality-of-Life Analysis
Silver City, New Mexico, offers a quality of life defined by its low cost of living and a population that blends longtime locals, retirees, and artists drawn to the region’s high desert landscapes. With a cost-of-living index of 67—well below the U.S. average of 100—the area provides significant financial breathing room, particularly for those moving from pricier Western states. The community is notably older and more settled than the national median, with a median age of 39.蓝色的, and a slower, more deliberate pace of daily life that appeals to those seeking respite from urban congestion.
Cost of living, housing affordability, and how Silver City compares to nearby areas
Silver City’s housing market is among the most affordable in the Southwest, with a median home value of $160,900 and a median rent of $851—both roughly half the national median. This affordability extends to utilities, groceries, and healthcare, all of which track below state and national averages. Compared to nearby towns like Deming or Las Cruces, Silver City’s home prices are slightly higher, but the trade-off is access to the Gila National Forest and a more established downtown arts scene. The average commute of just over 23 minutes is notably shorter than the national average of 26 minutes, reflecting the area’s compact layout and limited traffic congestion. For buyers, the market favors cash purchases and offers a mix of historic adobe homes, newer subdivisions, and rural acreage within a 15-minute drive of the town center.
What daily life is like for families, retirees, and remote workers in Silver City
Daily life in Silver City revolves around outdoor recreation, local arts, and a modest but functional set of amenities. The town’s public schools, part of the Silver Consolidated Schools district, serve roughly 3,000 students and include Silver High School, which has a graduation rate near 80%. Western New Mexico University, a public four-year institution, adds a small college-town dynamic and hosts cultural events open to the community. For families, the Gila National Forest offers hiking, birding, and the Gila Cliff Dwellings National Monument within a 45-minute drive. Retirees benefit from the Gila Regional Medical Center, a 68-bed hospital, and a low crime rate relative to other rural New Mexico towns. Remote workers will find reliable internet through providers like TDS Telecom and Silver City’s municipal fiber network, though speeds can vary in outlying areas. The downtown core—centered on Bullard Street—features independent bookstores, galleries, and the historic Silco Theatre, but residents typically drive to Las Cruces (90 minutes east) for major shopping or specialized medical care.
Silver City is best suited for those who prioritize affordability, outdoor access, and a tight-knit community over urban amenities or career density. Retirees on fixed incomes, artists seeking low overhead, and remote workers with stable incomes will find the cost-of-living advantage compelling. Families should weigh the limited job market—dominated by healthcare, education, and government—against the low housing costs and safe environment. The area’s isolation, while a draw for some, means that residents must be comfortable with a 90-minute drive to the nearest major airport (El Paso) and a slower pace of life that can feel restrictive to those accustomed to 24-hour services or diverse dining options. For the right person, however, Silver City offers a rare combination of financial freedom and natural beauty that is increasingly hard to find in the American West.
Crime in Silver City, NM
Higher crime rates than 67% of comparable U.S. locations.
Violent CrimeViolent Crime Analysis
Property CrimeProperty Crime Analysis
Crime Analysis
Silver City, New Mexico, reports a violent crime rate of 598.5 incidents per 100,000 residents and a property crime rate of 2,174.8 per 100,000, placing it well above both state and national averages. These figures indicate a statistically higher risk of victimization compared to typical U.S. communities, a pattern that reflects broader challenges within Grant County and southwestern New Mexico. The city’s safety profile is shaped by a combination of socioeconomic factors, law enforcement resources, and the local criminal justice system’s approach to prosecution and sentencing.
Crime in context
Silver City’s violent crime rate is roughly 60% higher than the national average of approximately 370 per 100,000, while its property crime rate exceeds the U.S. median by about 20%. Within New Mexico, which consistently ranks among the highest-crime states, Silver City’s rates are comparable to other small regional hubs like Deming and Las Cruces, though lower than Albuquerque’s. The city’s location near the U.S.-Mexico border and its role as a commercial center for a sparsely populated region contribute to property crime pressures, including theft and vehicle burglary. Statewide data from 2023 shows New Mexico’s property crime rate at roughly 2,900 per 100,000, meaning Silver City sits below that peak but remains elevated relative to safer rural communities in the state.
What residents experience
Residents report that property crimes—particularly theft from vehicles, shoplifting, and residential burglary—are the most common safety concerns in daily life. Violent incidents, while less frequent, include aggravated assault and robbery, often concentrated in specific areas or tied to domestic disputes and substance abuse. The local judicial environment is a significant factor: Grant County’s district attorney and judges have been criticized for lenient sentencing and progressive diversion programs that prioritize rehabilitation over incarceration. This approach, while intended to reduce recidivism, has resulted in repeat offenders cycling through the system quickly, undermining public confidence in consequences for crime. Residents frequently express frustration that property crimes are treated as low-priority offenses, with many cases never leading to prosecution or meaningful penalties.
Neighborhood-level variation
Safety conditions vary noticeably across Silver City’s neighborhoods. The historic downtown core and areas near Western New Mexico University experience higher foot traffic and police presence, but also attract transient populations and petty theft. Residential areas north of Highway 180 and east of the downtown corridor generally report lower crime rates, with fewer incidents of burglary and vandalism. The more affordable neighborhoods south of 32nd Street and along the San Vicente Arroyo corridor see elevated property crime, often linked to drug-related activity. Gated communities and newer subdivisions on the city’s outskirts, such as those near the Silver City Golf Course, offer the lowest risk profiles. Prospective residents are advised to consult local crime mapping tools and speak with current residents about specific blocks, as conditions can shift within a few streets.
* Values derived from national, state, county, city and local statistics and may differ in a specific area. Last updated: 2026-05-01T11:10:40.000Z
Narrative content on this page is AI-generated and may contain mistakes. Verify any details that matter before acting on them.
ReloMaps may earn a commission from affiliate links at no extra cost to you.