
Photo: Wikipedia
Demographics of Butte County
Affluence Level in Butte County
A middle-class area roughly in line with national averages across income, home values, education, and employment.
People of Butte County
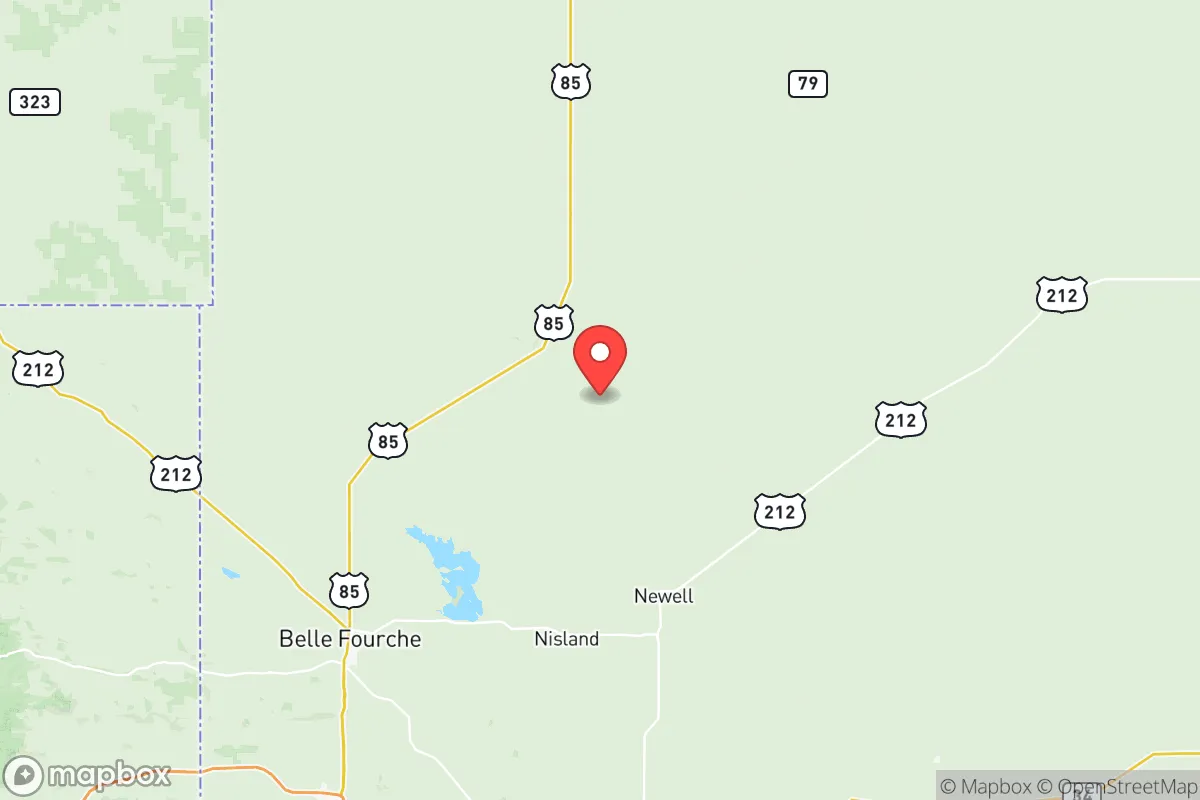
Today's Butte County population of 10,538 is overwhelmingly white (88.0%) and native-born, with foreign-born residents making up just 0.2% of the county — one of the lowest rates in the nation. The population is thinly spread across a ranching and agricultural landscape anchored by the county seat of Belle Fourche, with smaller communities like Newell, Vale, and Nisland dotting the prairies. With only 19.4% of adults holding a college degree, the county retains a blue-collar, rural character shaped by cattle ranching, hay farming, and energy extraction. The population is older and more homogeneous than the national average, reflecting the county's limited in-migration since the mid-20th century.
Settlement & growth (pre-1960)
Before American settlement, the area that is now Butte County was part of the traditional territory of the Lakota Sioux, particularly the Oglala and Sicangu bands. The region fell within the Great Sioux Reservation established by the 1868 Treaty of Fort Laramie, but the U.S. government forcibly opened the land to non-Native settlement after the 1874 Black Hills gold discovery and the subsequent Sioux Wars. By the early 1880s, the reservation had been broken up through a series of agreements and legislative acts, and the land was surveyed for homesteading.
The first permanent American settlers arrived in the late 1880s, drawn by the promise of free land under the Homestead Act of 1862. These early homesteaders were overwhelmingly of Northern European stock: Germans, Norwegians, Swedes, Danes, English, Scots, and Scots-Irish. They filed claims along the agricultural land near the Belle Fourche River, founding small settlements such as Vale and Fruitdale in the 1880s and 1890s. The arrival of the Chicago, Burlington and Quincy Railroad in 1890 triggered the founding of Belle Fourche, which quickly became the county's commercial and transportation hub as a cattle-shipping point on the main line to Chicago.
A second major wave of settlement followed the Belle Fourche Irrigation Project, authorized by the U.S. Reclamation Service in 1908. The project diverted water from the Belle Fourche River to irrigate over 100,000 acres of formerly arid land, transforming the region from open-range ranching into a mosaic of crop farming and improved pasture. New towns sprang up to serve the irrigated farms: Newell was platted in 1910 as a direct result of the project; Nisland and Castle Rock followed soon after as farm-service communities. These settlements attracted a second wave of homesteaders, many of them second-generation German and Scandinavian immigrants moving from the Dakotas' eastern counties, as well as a smaller number of Russian Germans who had previously settled in Kansas and Nebraska.
The Dust Bowl of the 1930s hit Butte County hard, as prolonged drought and wind erosion devastated dryland wheat farms. Many homesteaders in communities like Hoover and Hereford abandoned their claims, returning to urban areas or migrating west. Agricultural consolidation after World War II accelerated the thinning of the population: small family farms merged into larger operations, and the children of farmers increasingly left for jobs in Rapid City or out of state. By 1960, the county's population had already begun a long-term decline from its 1930 peak of just over 14,000, settling into the pattern of slow but steady shrinkage that would define the next six decades.
Modern era (post-1965)
The 1965 Hart-Cellar Act, which fundamentally reshaped U.S. immigration by opening doors to Asia, Africa, and Latin America, had virtually no measurable impact on Butte County. Foreign-born residents today account for just 0.2% of the population, and the county has never developed a significant immigrant community or ethnic enclave. The county's demographics have remained extraordinarily stable: White residents make up 88.0% of the population, a share that has declined only slightly
* Values derived from national, state, county, city and local statistics and may differ in a specific area. Last updated: 2026-06-03T06:25:01.000Z
Narrative content on this page is AI-generated and may contain mistakes. Verify any details that matter before acting on them.
ReloMaps may earn a commission from affiliate links at no extra cost to you.