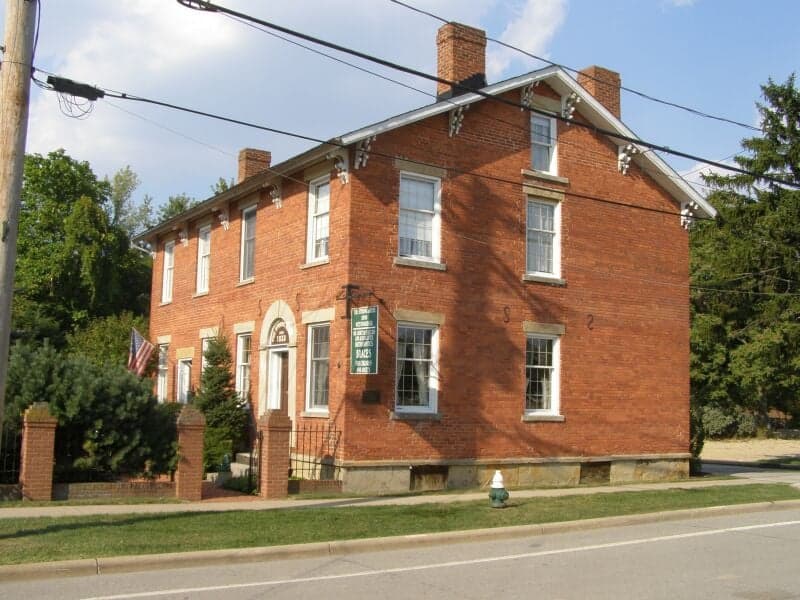
Photo: Wikipedia
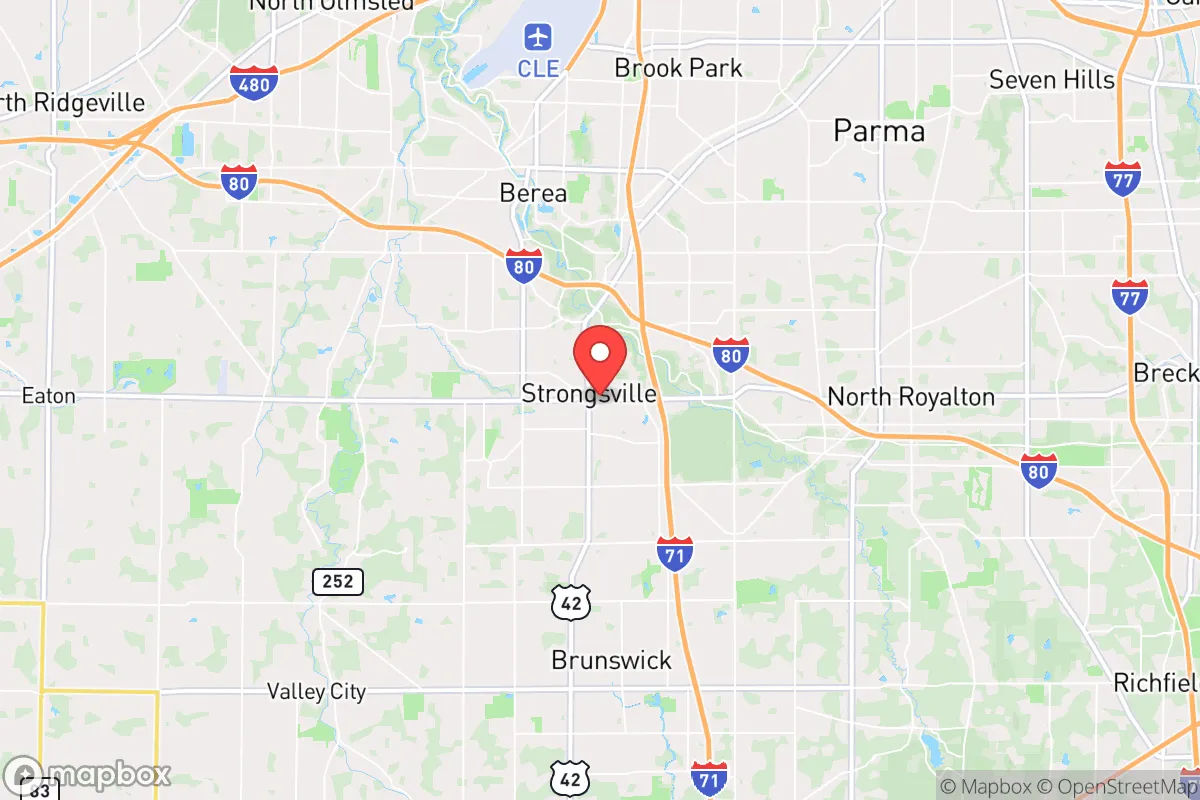
Demographics of Strongsville, OH
Affluence Level in Strongsville, OH
A middle-class area roughly in line with national averages across income, home values, education, and employment.
People of Strongsville, OH
Strongsville, Ohio, is a predominantly white, upper-middle-class suburb of 46,022 residents, known for its strong school system, low crime rates, and a distinctly family-oriented character. The city’s population is notably well-educated, with 48.2% holding a college degree, and it leans politically conservative, reflecting its roots as a quiet farming community that transformed into a sought-after bedroom suburb. While the population is 85.1% white, the most significant minority group is the Indian subcontinent community at 5.5%, a demographic that has grown rapidly since the 1990s and is now a visible part of the city’s professional class. This is not a diverse melting pot in the traditional sense, but rather a place where distinct, stable enclaves have formed around shared values of education, property ownership, and community safety.
How the city was settled and grew
Strongsville was founded in 1818 by John Stoughton Strong, a Connecticut land speculator, who purchased the township and sold plots to Yankee settlers from New England. These early families—names like Ehrnfelt, Drake, and Lunn—were farmers drawn by the fertile soil of the Cuyahoga Valley and the promise of cheap land under the Connecticut Western Reserve. The original settlement clustered around the intersection of Pearl Road and Royalton Road, an area now known as Historic Strongsville, where many of the 19th-century homes and the town square remain. A second wave of German and Irish immigrants arrived in the late 1800s to work in the sandstone quarries and on the railroad, settling in the Zaborski and Drake neighborhoods near the railroad tracks. For over a century, Strongsville remained a small, agrarian community—its population was just 1,500 in 1900 and only 8,000 by 1950—with a tight-knit, Protestant, and overwhelmingly white character that persisted through the mid-20th century.
Modern era (post-1965)
The post-1965 era brought dramatic change, driven not by the Hart-Cellar Act’s immigration reforms but by domestic suburbanization. The completion of Interstate 71 in the 1970s turned Strongsville into a prime commuter suburb for Cleveland, Akron, and the growing industrial corridor. Developers built sprawling subdivisions of single-family homes, and the population exploded from 15,000 in 1970 to 35,000 by 1990. This wave was almost entirely white, middle-class families moving from Cleveland’s west side and inner-ring suburbs like Parma, seeking larger lots and better schools. The Lunn and Ehrnfelt neighborhoods, built in the 1970s and 1980s, became the heart of this new suburban identity—quiet, cul-de-sac communities with high homeownership rates. The most notable demographic shift began in the 1990s, when a small but growing number of Indian subcontinent professionals—engineers, doctors, and IT workers—began moving into the Albion and Valley View subdivisions, drawn by the strong school system and proximity to tech employers in Beachwood and Cleveland’s University Circle. Today, the Indian subcontinent community makes up 5.5% of the population, a share that has more than doubled since 2000, while the East/Southeast Asian population (1.8%) and Hispanic population (2.9%) have grown more slowly. The Black population remains very small at 2.2%, and the foreign-born share is just 2.6%, indicating that most growth has come from domestic migration rather than international immigration.
The future
The population of Strongsville is heading toward a slow, steady homogenization with a distinct professional-class overlay. The white population, while still dominant, is aging—the median age is 44, and many long-time residents are empty-nesters. Younger families, both white and Indian subcontinent, are moving into the newer developments on the city’s south and west edges, such as the SouthPark Center area and the Royalton Road corridor, where home prices remain high but offer more space. The Indian subcontinent community is not forming a separate enclave but is dispersing into the same subdivisions as white families, a pattern of assimilation driven by shared educational and professional aspirations. The Hispanic and East/Southeast Asian populations are likely to remain small and stable, as Strongsville lacks the entry-level housing and industrial jobs that attract larger immigrant communities. Over the next 10-20 years, the city will likely become slightly more diverse at the margins, but its core identity as a white, college-educated, conservative suburb will persist. The biggest demographic pressure is not racial or ethnic change, but generational turnover—whether the city can attract enough young families to replace its aging boomer population without sacrificing its character.
For a conservative-leaning family or individual considering a move, Strongsville is becoming a place where traditional suburban values—good schools, low crime, stable property values—are reinforced by a population that is highly educated and economically secure. The Indian subcontinent community is integrated and upwardly mobile, not a source of cultural friction, and the city shows no signs of the rapid diversification that has reshaped other Cleveland suburbs. This is a community that is changing slowly, on its own terms, and remains a safe bet for those seeking a predictable, family-oriented environment.
* Values derived from national, state, county, city and local statistics and may differ in a specific area. Last updated: 2026-04-21T18:06:48.000Z
Narrative content on this page is AI-generated and may contain mistakes. Verify any details that matter before acting on them.
ReloMaps may earn a commission from affiliate links at no extra cost to you.