Photo: Wikipedia
Demographics of Madison County
Affluence Level in Madison County
A below-average socioeconomic profile. Incomes, home values, and educational attainment trail the U.S., with higher poverty and unemployment.
People of Madison County
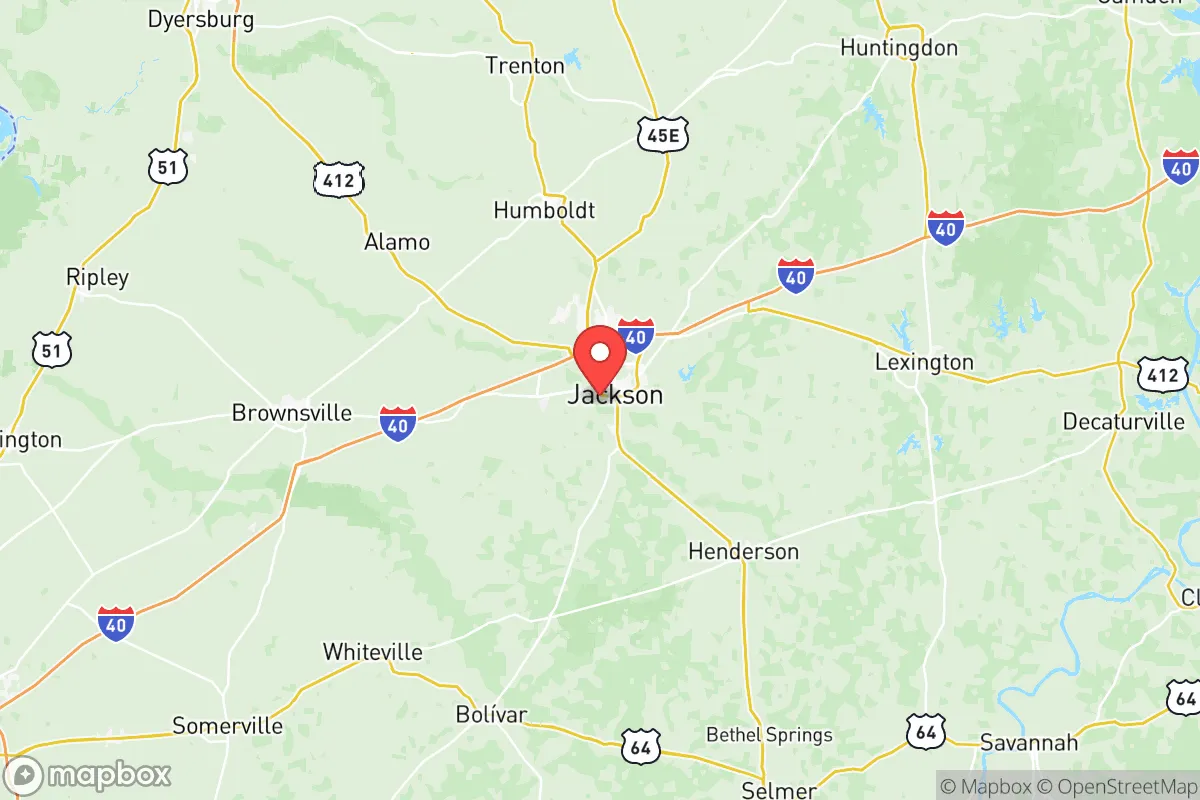
Madison County, Tennessee, is a community of nearly 99,000 residents defined by its deep-rooted Southern identity, a significant Black population that has shaped its culture for generations, and a growing Hispanic presence that is slowly diversifying its historically biracial character. The county is anchored by the city of Jackson, the regional hub, and is characterized by a population that is 53.5% White, 36.5% Black, and 5.0% Hispanic, with a very small foreign-born share of just 2.1%. This is a place where the legacy of the Old South and the Civil Rights era still resonates, but where modern economic shifts and suburban expansion are gradually reshaping who lives here and why.
Settlement & growth (pre-1960)
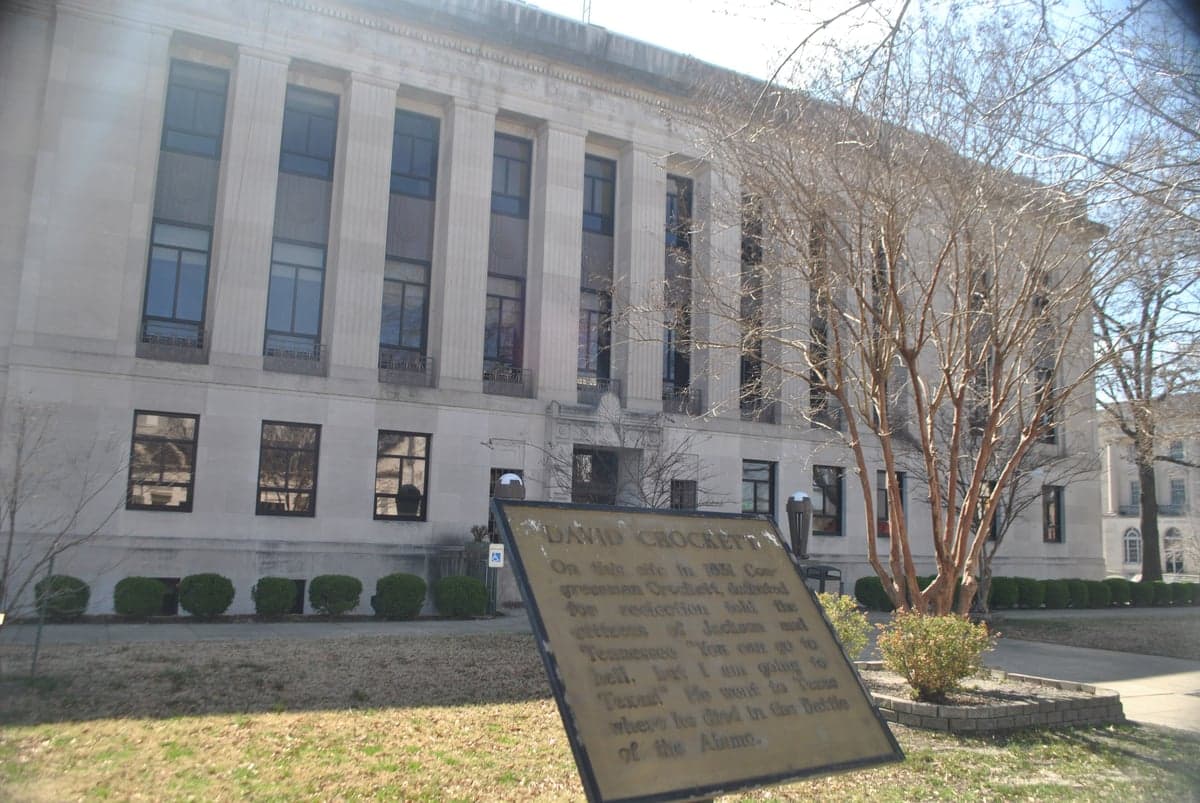
Before American settlement, the land that is now Madison County was part of the hunting grounds of the Chickasaw Nation, who ceded the territory to the United States in the 1818 Jackson Purchase. The county was formally established in 1821 and named after President James Madison, with the town of Jackson laid out as the county seat the same year. The earliest White settlers were predominantly of Scots-Irish and English stock, migrating from Virginia, North Carolina, and Kentucky via the Tennessee Valley. They were drawn by the promise of fertile, inexpensive land for cotton plantations, which quickly became the economic backbone of the region.
The plantation economy brought a forced migration of enslaved Black people from the Upper South, who by 1860 made up a majority of the county's population. After the Civil War and Emancipation, many freedmen remained in the area as sharecroppers and tenant farmers, establishing distinct communities such as the historic African American neighborhoods of East Jackson and the rural settlement of Medon. The post-Reconstruction era saw the rise of Jim Crow laws, but also the growth of Black-owned businesses and institutions, including Lane College, a historically Black college founded in Jackson in 1882 by the Christian Methodist Episcopal Church.
The late 19th and early 20th centuries brought a modest influx of German and Irish immigrants, who worked on the railroads and in the growing timber and cotton-processing industries. These groups largely settled in Jackson proper, particularly around the railroad depots and industrial corridors. The Great Migration (1910-1970) saw tens of thousands of Black residents leave Madison County for industrial jobs in Chicago, Detroit, and St. Louis, a demographic shift that reduced the Black population share from a majority to a large minority. Meanwhile, the Dust Bowl and Great Depression brought few new arrivals to the county, as the agricultural economy struggled. World War II and the subsequent expansion of the federal government brought some new residents to Jackson, including the establishment of a Veterans Administration hospital, but the county remained overwhelmingly rural and biracial through the 1950s.
Modern era (post-1965)
The 1965 Hart-Cellar Act had a minimal direct impact on Madison County, as the area did not attract the large-scale immigration seen in coastal or major Sun Belt cities. The foreign-born population remains very low at 2.1%, a figure that has only crept up in the last two decades. The most significant demographic shift since 1965 has been the steady suburbanization of Jackson and the growth of outlying towns. The construction of Interstate 40 in the 1960s, which runs just north of Jackson, made the county more accessible and spurred the development of bedroom communities like Three Way and Humboldt (partially in Madison County).
The domestic migration pattern since the 1970s has been one of slow, steady growth driven by White flight from rural areas to Jackson's suburbs, and later by a modest return migration of Black families from Northern cities seeking lower costs of living and family ties. The Hispanic population, while still small at 5.0%, has grown noticeably since the 1990s, primarily driven by Mexican immigrants and their U.S.-born children who work in agriculture (especially cotton and soybean farming), construction, and the food processing industry. This community is concentrated in Jackson's western neighborhoods and in the rural areas around Bells and Oakfield. The East/Southeast Asian population (0.8%) is tiny and largely consists of professionals employed by the county's two major hospitals and the University of Memphis at Lambuth campus. The Indian subcontinent population (0.2%) is even smaller, primarily comprising a handful of physicians and engineers.
The most notable modern trend is the slow but steady diversification of the county's historically Black and White binary. The White population share has declined from over 60% in 1990 to 53.5% today, while the Hispanic share has grown from under 1% to 5%. The Black population share has remained relatively stable, hovering around 36-38% since 2000, as out-migration has slowed and natural increase has offset losses. The college-educated share of 26.0% is below the national average, reflecting the county's industrial and agricultural economic base, though it is rising with the growth of healthcare and logistics jobs.
The future
Madison County is likely to continue its slow, incremental diversification over the next 10-20 years, but it will remain a predominantly biracial Southern community. The Hispanic population is projected to grow to 8-10% of the total by 2040, driven by higher birth rates and continued labor migration, but this growth will be gradual and will not fundamentally alter the county's cultural or political character. The Black population share is expected to remain stable or decline slightly, as younger Black residents continue to leave for larger metropolitan areas with more economic opportunities. The White population share will continue its slow decline, but will remain the largest single group.
The county is not tribalizing into distinct ethnic enclaves in the way that larger cities have. Instead, the pattern is one of gradual assimilation, with Hispanic families increasingly moving into previously all-White or all-Black neighborhoods in Jackson and the surrounding towns. The foreign-born population will remain very low, meaning that the county will not experience the kind of cultural transformation seen in Nashville or Memphis. The biggest demographic driver will be domestic migration from higher-cost areas in California, the Northeast, and the Midwest, attracted by low housing costs and a conservative political environment. This in-migration will be predominantly White and will reinforce the county's existing cultural identity rather than challenge it.
For someone moving to Madison County today, the reality is that this is a place where the past is still very present. The population is stable, rooted, and largely homogeneous in its American-born character. The future will bring more Hispanic families and a few more professionals from outside the region, but the county will remain a place where the Black and White communities, with their long and intertwined history, continue to define the social landscape. The growth will be slow, the changes incremental, and the cultural identity resilient.
* Values derived from national, state, county, city and local statistics and may differ in a specific area. Last updated: 2026-05-12T14:06:17.000Z
Narrative content on this page is AI-generated and may contain mistakes. Verify any details that matter before acting on them.
ReloMaps may earn a commission from affiliate links at no extra cost to you.