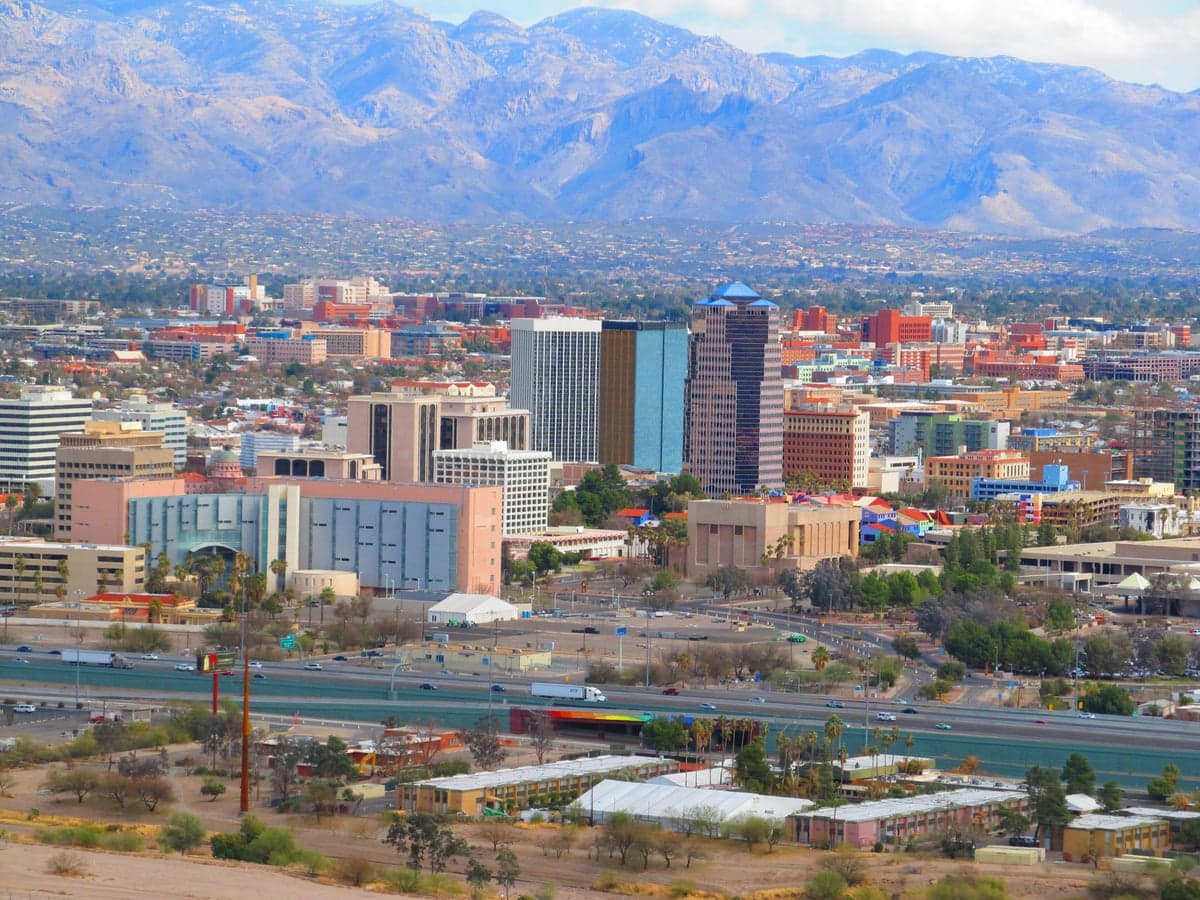
Photo: Wikipedia
Quality of Life in Tucson, AZ
A high quality of life with strong walkability, manageable living costs, healthy neighborhood signals, and solid amenity access.
What does Quality of Life tell us?
Quality of Life blends cost of living, nearby amenities, socioeconomic signals, and neighborhood character. City-level scores represent the whole municipality; individual neighborhoods can differ.
What does this tell us?
Quality of Life blends cost of living, nearby amenities, socioeconomic signals, and neighborhood character. City-level scores represent the whole municipality; individual neighborhoods can differ.
Cost of Living
10% below national average
The Real Cost of Living in Tucson, AZ for 2026
| Tier | Individual | Family (4) |
|---|---|---|
| Survival | $17k | $32k |
| Comfortable | $47k | $69k |
| Luxury | $99k+ | $153k+ |
| Elite (Top 5%) | $116k+ | $180k+ |
79%
The Area Signal
A metric tracking the socioeconomic signals of the area.
Hobbies
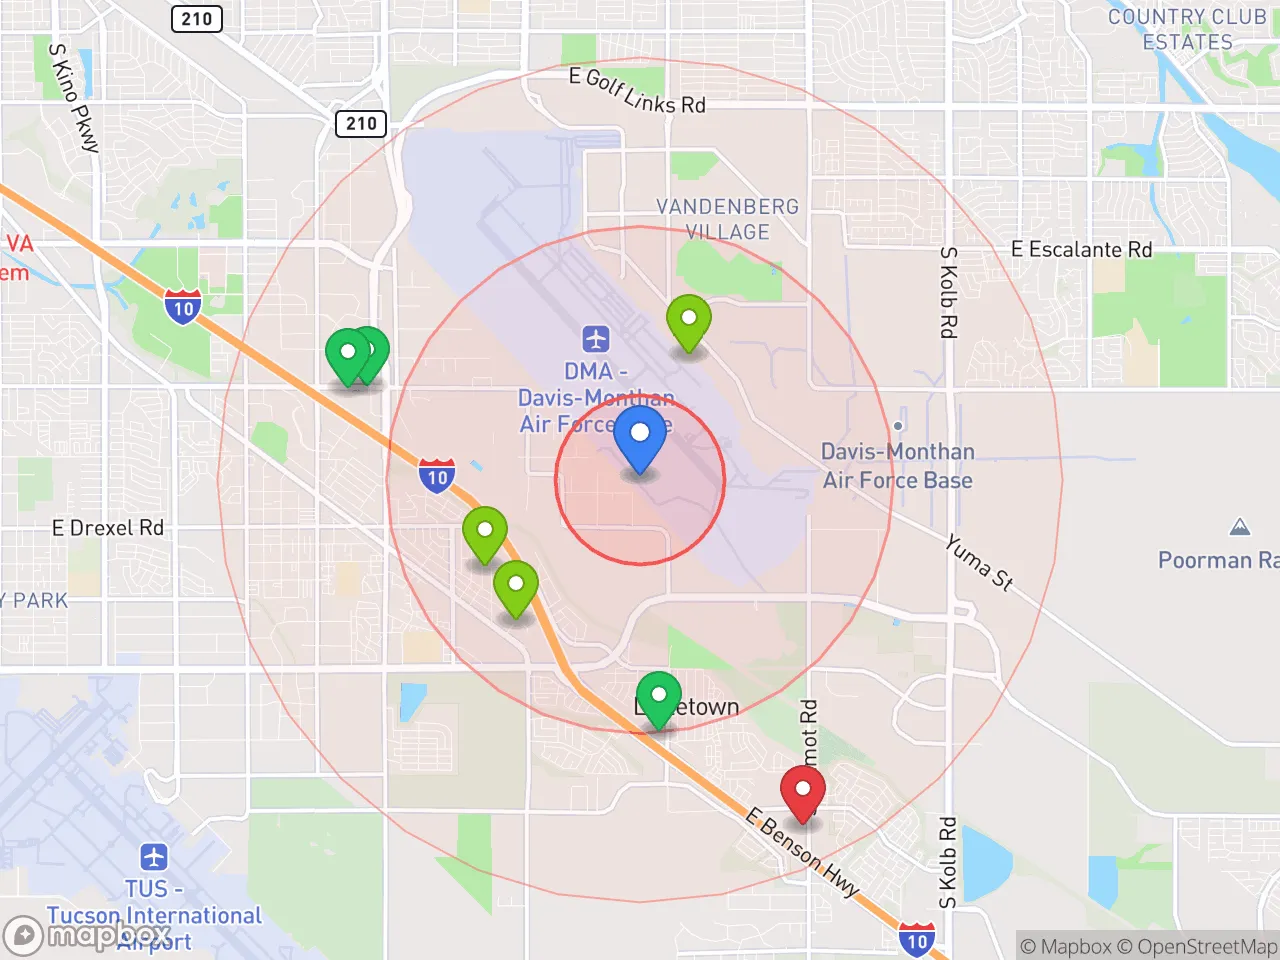
Explore the areaGroceries
7 within 10 miles
Gas
20 within 10 miles
Hospital
20 within 20 miles
Airport
SAN — San Carlos Apache
Post Office
USPS — Tucson, AZ
Critical Amenities
Quality-of-Life Analysis
Tucson offers a quality of life defined by a cost of living well below the national average, attracting a diverse mix of retirees, remote workers, University of Arizona students, and families seeking affordable sunbelt living. With a cost of living index of 90 (10% below the U.S. average), the city provides significant financial breathing room compared to Phoenix or coastal metros, though wages in many local sectors lag behind those higher-cost peers. The population skews slightly younger than the national median due to the university presence, while a substantial retiree community is drawn to the dry climate and lower housing costs.
Cost of living, housing affordability, and how Tucson compares to Phoenix
Tucson’s housing market remains one of the most accessible among major Western cities. The median home value sits at $242,200, roughly half the median in Phoenix ($430,000) and a fraction of Los Angeles or Denver prices. Median rent is $1,079, making it feasible for single-income households and graduate students to live alone in central neighborhoods like Sam Hughes or the historic Barrio Viejo. While grocery and utility costs track near the national average, the biggest savings come from housing. The trade-off is a slower job market: major employers include the University of Arizona, Raytheon Missiles & Defense, and Davis-Monthan Air Force Base, but professional salaries in tech and finance are typically 15-25% lower than in Phoenix. Commute times average 22.2 minutes, well under the national average of 26 minutes, thanks to less congested freeways (I-10 and I-19) and a grid street system that disperses traffic.
Daily life, outdoor amenities, and what families and retirees can expect
Daily life in Tucson revolves around its desert environment and a relaxed, informal pace. The city is ringed by five mountain ranges—the Santa Catalinas, Rincons, Tucsons, Tortolitas, and Sierritas—providing immediate access to hiking, mountain biking, and rock climbing in Saguaro National Park and Sabino Canyon. The school landscape is mixed: the Tucson Unified School District offers magnet programs like University High School (consistently ranked among Arizona’s top public high schools), but many families with means opt for charter schools such as BASIS Tucson or private institutions like St. Gregory College Preparatory School. The culinary scene is anchored by Sonoran Mexican food—carne seca, Sonoran hot dogs, and flour tortillas made fresh at places like El Guero Canelo—and a growing craft beer corridor along Fourth Avenue. The University of Arizona brings a steady calendar of Pac-12 sports, concerts at the Centennial Hall, and lectures, while the winter visitor season (October through April) fills the city with snowbirds and cultural festivals like the Tucson Gem and Mineral Show.
Tucson is best suited for those who prioritize affordability, outdoor recreation, and a slower pace over high-end urban amenities or rapid career advancement. Remote workers and retirees will find the most value, as the low housing costs and 350 days of sunshine per year create a comfortable base for a self-directed lifestyle. Families should weigh the school choice landscape carefully—strong options exist but require active selection—while young professionals may find the job market limited unless they work in aerospace, education, or healthcare. The city’s biggest drawback is the summer heat (June through August highs average 100°F+), but for those who can adapt, Tucson delivers a quality of life that is both financially sustainable and deeply connected to the Sonoran Desert.
Crime in Tucson, AZ
Crime rates similar to the national median for U.S. locations.
Violent CrimeViolent Crime Analysis
Property CrimeProperty Crime Analysis
Crime Analysis
Tucson's overall safety picture is shaped by crime rates that significantly exceed both state and national averages, a reality that prospective residents must weigh carefully. The city's violent crime rate stands at 354.8 incidents per 100,000 residents, while property crime is reported at 2,041.8 per 100,000. These figures place Tucson among the higher-crime metro areas in the Southwest, and the local justice system's progressive orientation is a contributing factor that directly impacts public safety.
Crime in context
When compared to Arizona's statewide violent crime rate of roughly 260 per 100,000 and the national average of approximately 380 per 100,000, Tucson's violent crime rate is about 36% higher than the state figure but slightly below the national benchmark. The property crime rate, however, is a more acute concern: it is nearly double the national average of around 1,100 per 100,000 and significantly above Arizona's state rate of about 1,500 per 100,000. These numbers reflect a persistent property crime problem, particularly in auto theft and burglary. A key driver of these elevated rates is the region's progressive prosecutorial approach. Pima County has elected district attorneys and judges who prioritize diversion programs and reduced sentencing for non-violent offenders. While intended to reduce incarceration, this ideology has a direct negative consequence: more criminals remain on the street, cycling through the system without meaningful accountability. This approach undermines justice for victims and emboldens repeat offenders, contributing to Tucson's stubbornly high crime statistics.
What residents experience
For daily life, the practical impact is most visible in property crime. Residents report that car break-ins, package theft, and home burglaries are common occurrences, even in areas considered "safe." The city's police department, while responsive, is often stretched thin by the volume of calls. Violent crime, while less frequent than property crime, is concentrated in specific areas and often involves individuals who know each other, but random incidents do occur. The progressive justice system's focus on offender rehabilitation over public protection means that victims frequently see their cases plea-bargained down or dismissed, eroding trust in the legal process. This environment creates a heightened sense of vigilance among locals, who routinely invest in security systems, steering wheel locks, and neighborhood watch participation as a matter of course.
Neighborhood-level variation is significant. Areas like the Catalina Foothills and Oro Valley (just north of Tucson) report crime rates far below the city average, while central Tucson neighborhoods near the university and south-side districts experience the highest concentrations of both property and violent crime. Prospective residents should research specific zip codes and consult local crime maps, as the difference between a safe block and a high-risk one can be just a few streets. The overarching reality is that Tucson's crime problem is systemic, not isolated, and the progressive policies of its elected officials are a primary reason for concern.
* Values derived from national, state, county, city and local statistics and may differ in a specific area. Last updated: 2026-05-01T21:59:19.000Z
Narrative content on this page is AI-generated and may contain mistakes. Verify any details that matter before acting on them.
ReloMaps may earn a commission from affiliate links at no extra cost to you.