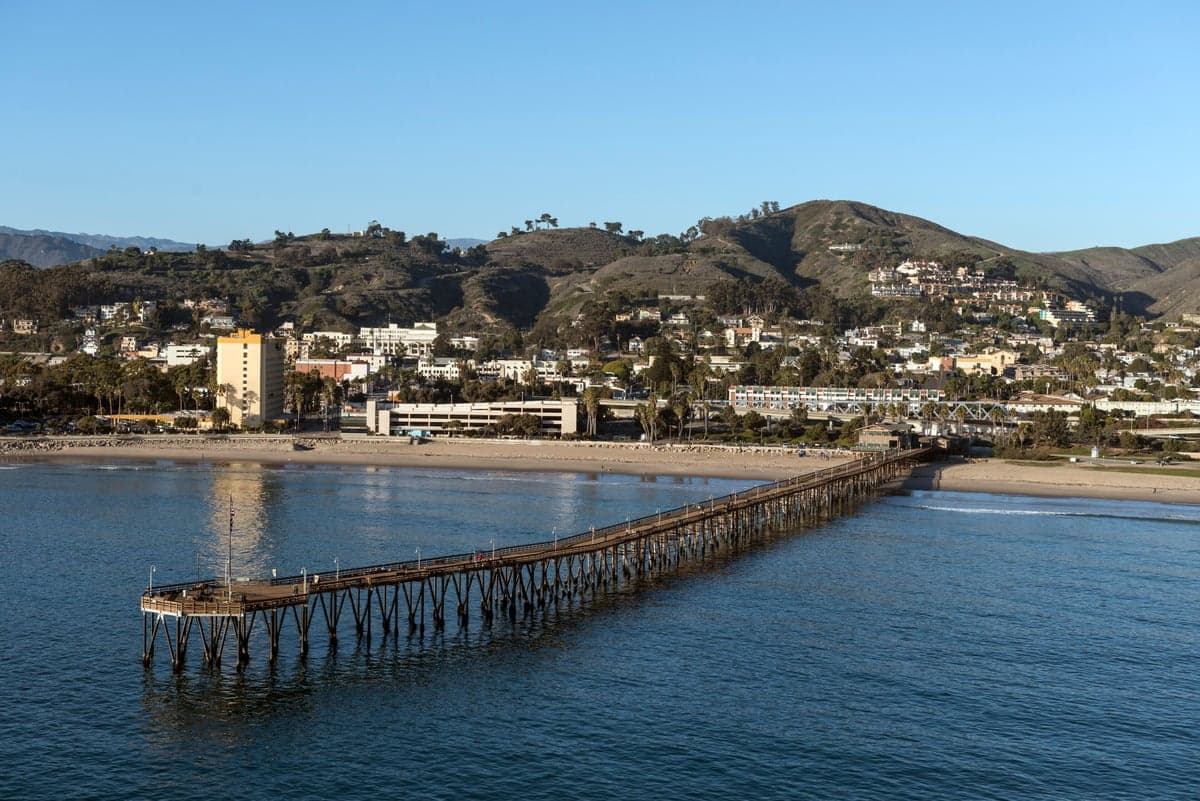
Photo: Wikipedia
Quality of Life in Ventura, CA
A high quality of life with strong walkability, manageable living costs, healthy neighborhood signals, and solid amenity access.
What does Quality of Life tell us?
Quality of Life blends cost of living, nearby amenities, socioeconomic signals, and neighborhood character. City-level scores represent the whole municipality; individual neighborhoods can differ.
What does this tell us?
Quality of Life blends cost of living, nearby amenities, socioeconomic signals, and neighborhood character. City-level scores represent the whole municipality; individual neighborhoods can differ.
Cost of Living
119% above national average
The Real Cost of Living in Ventura, CA for 2026
| Tier | Individual | Family (4) |
|---|---|---|
| Survival | $34k | $63k |
| Comfortable | $110k | $162k |
| Luxury | $162k+ | $250k+ |
| Elite (Top 5%) | $190k+ | $295k+ |
62%
The Area Signal
A metric tracking the socioeconomic signals of the area.
Hobbies
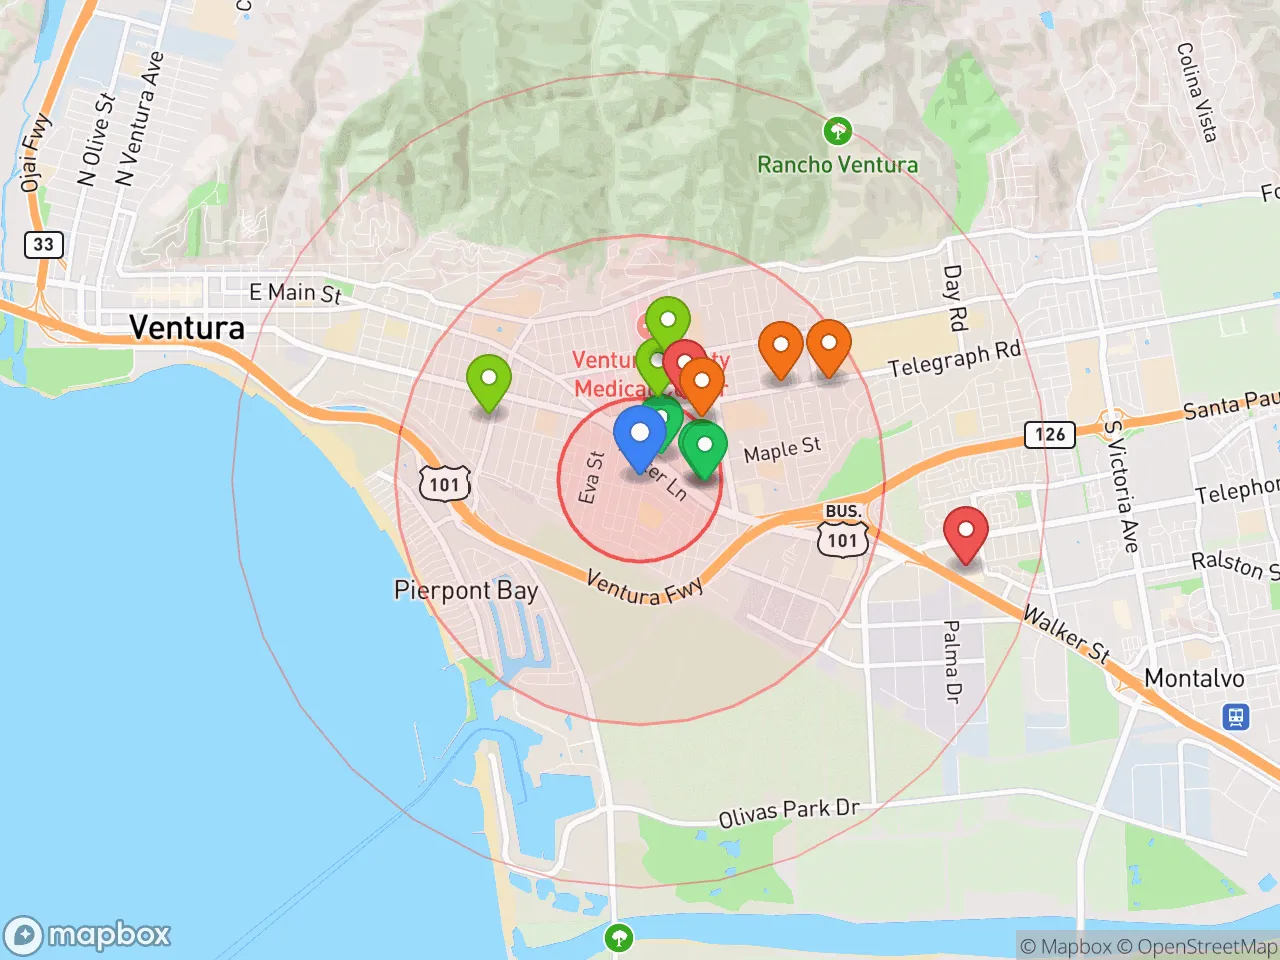
Explore the areaGroceries
6 within 10 miles
Gas
20 within 10 miles
Hospital
10 within 20 miles
Airport
LAX — Los Angeles International
Post Office
USPS — Ventura, CA
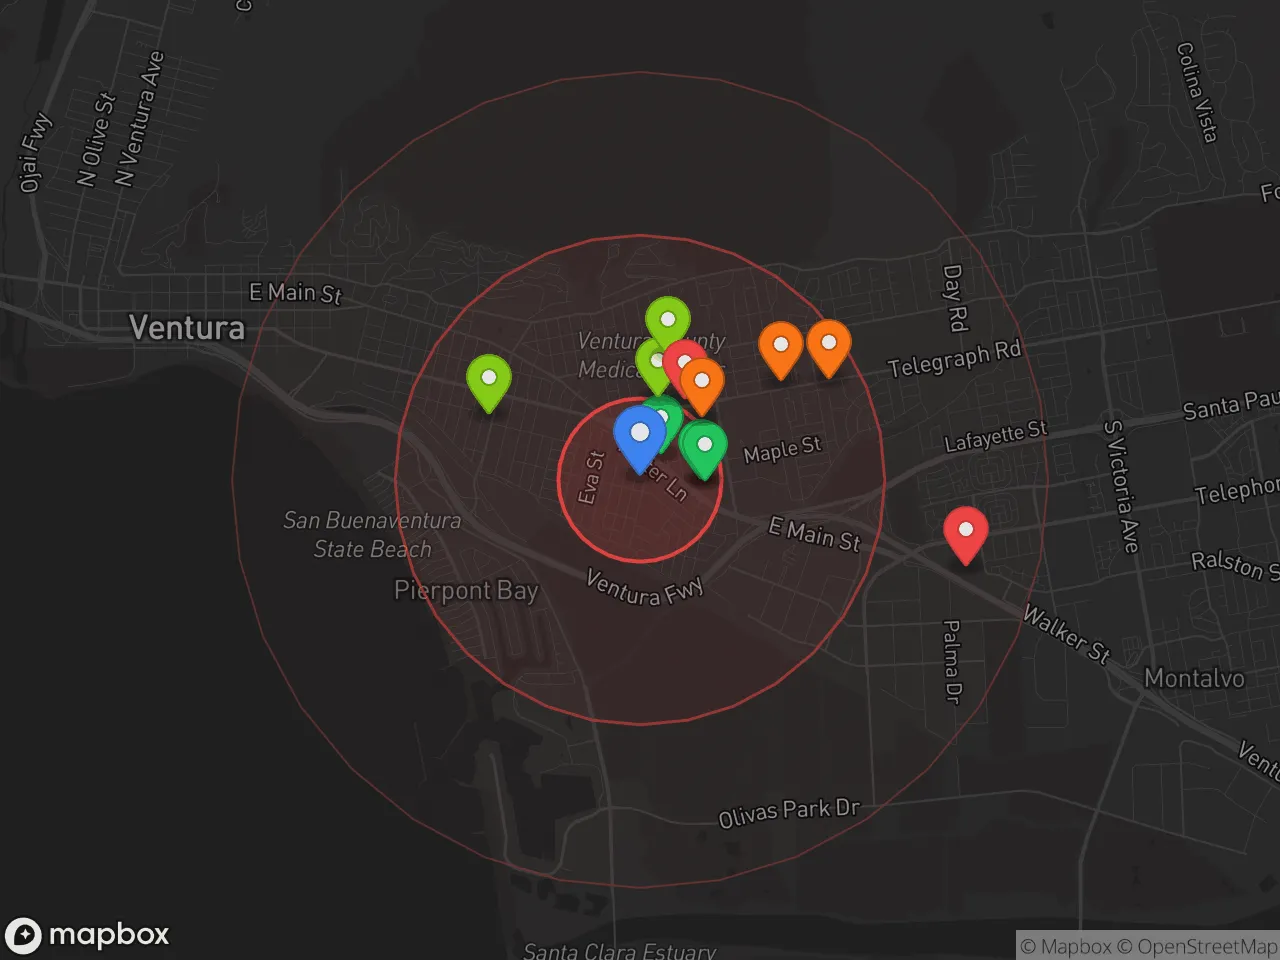
Critical Amenities
Quality-of-Life Analysis
Ventura, California, presents a quality of life defined by coastal affluence and a distinctly laid-back, family-oriented atmosphere. With a cost of living index of 219—more than double the national average—the city attracts a demographic mix of established professionals, remote workers, and retirees who prioritize ocean access and a slower pace over the career intensity of Los Angeles or Santa Barbara. The population skews older and more settled, with a median age around 40, reflecting a community that values stability, outdoor recreation, and a strong sense of local identity.
Cost of living, housing, and affordability compared to nearby coastal cities
Ventura’s housing market is the primary driver of its high cost of living. The median home value of $778,700 is significantly lower than Santa Barbara’s median (often exceeding $1.5 million) but still roughly 40% higher than the national median. For renters, the median rent of $2,101 is steep but offers a relative bargain compared to coastal Los Angeles County, where similar units frequently command $2,800+. The average commute of 24.4 minutes is notably short for the region—far less than the 45+ minute slog common in Ventura County’s commuter-heavy eastern cities like Thousand Oaks. This shorter commute is a major quality-of-life advantage, allowing residents to spend more time at the beach or on the nearby Ventura River Trail rather than in traffic. However, for households earning the local median income of roughly $85,000, the housing cost burden is severe: a typical mortgage on a median-priced home would consume over 50% of gross income, pushing many families toward renting or looking inland to Oxnard or Santa Paula for more affordable options.
Local amenities, schools, and what daily life actually feels like
Daily life in Ventura revolves around its compact, walkable downtown and its two-mile stretch of state beach. The Ventura Unified School District earns solid marks, with Foothill Technology High School and Ventura High School both rated among the top 10% in California by U.S. News & World Report. The city’s amenity density is high for its size: residents have direct access to the Channel Islands National Park via the Ventura Harbor, a thriving farmers’ market on Main Street, and the historic Mission San Buenaventura. The rhythm is distinctly unhurried—surf checks in the morning, coffee at a local roastery like Beacon Coffee, and evenings spent at the San Buenaventura State Beach. Compared to the polished, resort-town feel of Santa Barbara, Ventura retains a grittier, more authentic working-class character, with a noticeable presence of surf culture and agricultural roots (the city is surrounded by citrus and avocado groves). The trade-off is a limited nightlife scene and fewer high-end dining options than in neighboring Montecito or Westlake Village.
Ventura is best suited for those who can absorb its high housing costs in exchange for a genuine coastal lifestyle with strong schools and a short commute. It works well for dual-income professional families, remote workers earning coastal salaries, and retirees seeking a quieter, sun-soaked alternative to the congestion of Southern California’s major metros. Budget-conscious newcomers or those seeking a vibrant urban scene will find the city expensive and sleepy; for everyone else, Ventura offers a rare balance of natural beauty, community cohesion, and manageable daily logistics.
Crime in Ventura, CA
WARNING: The crime statistics are unreliable for this jurisdiction. Local authorities have either not reported or under reported their data to the FBI. This could be due to bad intentions, incompetence or technical issues. Regardless, we suggest skepticism.
Higher crime rates than 61% of comparable U.S. locations.
Violent CrimeViolent Crime Analysis
Property CrimeProperty Crime Analysis
Crime Analysis
Ventura, California, presents a mixed safety profile that requires careful consideration, particularly for those relocating from lower-crime regions. The city's overall crime rate is elevated compared to national averages, with property crime posing a more significant concern than violent offenses. Prospective residents should weigh these statistics against the benefits of coastal living and be aware that local criminal justice policies may influence public safety outcomes.
Crime in context
Ventura's violent crime rate stands at 349.3 incidents per 100,000 residents, which is notably higher than the national average of roughly 380 per 100,000 but slightly below the California state average of approximately 442 per 100,000. Property crime is a more pressing issue, with a rate of 1,785 per 100,000—significantly exceeding both the national average (around 1,954) and the California average (about 2,110). These figures place Ventura in a moderate-risk category among California's mid-sized coastal cities. However, the broader context of Ventura County's progressive judicial philosophy is a critical factor. Like many liberal-leaning jurisdictions in California, Ventura County has adopted policies emphasizing rehabilitation and diversion over incarceration. While intended to reduce recidivism, these approaches have been criticized for releasing repeat offenders back onto the streets, contributing to property crime cycles and undermining deterrence. Readers should be aware that such ideological stances, though sympathetic to offenders, can directly impact public safety and victim justice.
What residents experience
Daily life in Ventura involves navigating a tangible property crime risk. Car burglaries, package thefts, and bicycle thefts are common complaints, particularly in tourist-heavy areas like the Ventura Pier and downtown Main Street. Violent crime, while less frequent, does occur and is often concentrated in specific neighborhoods or tied to gang activity. Residents report that police response times can be delayed due to staffing shortages and a focus on non-violent calls, a pattern exacerbated by progressive policies that deprioritize certain low-level offenses. The city's homeless population, estimated at over 1,000 individuals, also contributes to visible disorder and occasional confrontations, particularly near the Ventura River bottom and beachfront areas. For families and professionals, the most practical concern is securing homes and vehicles—installing security systems, using steering wheel locks, and avoiding leaving valuables in plain sight are common precautions.
Neighborhood-level variation
Safety in Ventura varies significantly by neighborhood. The Midtown and East Ventura areas, including the hillside communities of Ventura Avenue and Foothill Road, generally report lower crime rates and stronger community watch programs. In contrast, the Westside and downtown core experience higher rates of property crime and occasional violent incidents, particularly near bars and late-night establishments. The Pierpont Bay and Ventura Keys neighborhoods, while desirable for their waterfront access, are not immune to vehicle break-ins and thefts targeting tourists. Prospective renters and buyers should research specific block-level crime maps and consider visiting at different times of day to gauge real conditions. Given the progressive judicial environment, residents should anticipate that even reported crimes may not always lead to meaningful consequences for offenders, making personal vigilance and neighborhood cohesion essential safety strategies.
* Values derived from national, state, county, city and local statistics and may differ in a specific area. Last updated: 2026-04-22T01:17:10.000Z
Narrative content on this page is AI-generated and may contain mistakes. Verify any details that matter before acting on them.
ReloMaps may earn a commission from affiliate links at no extra cost to you.