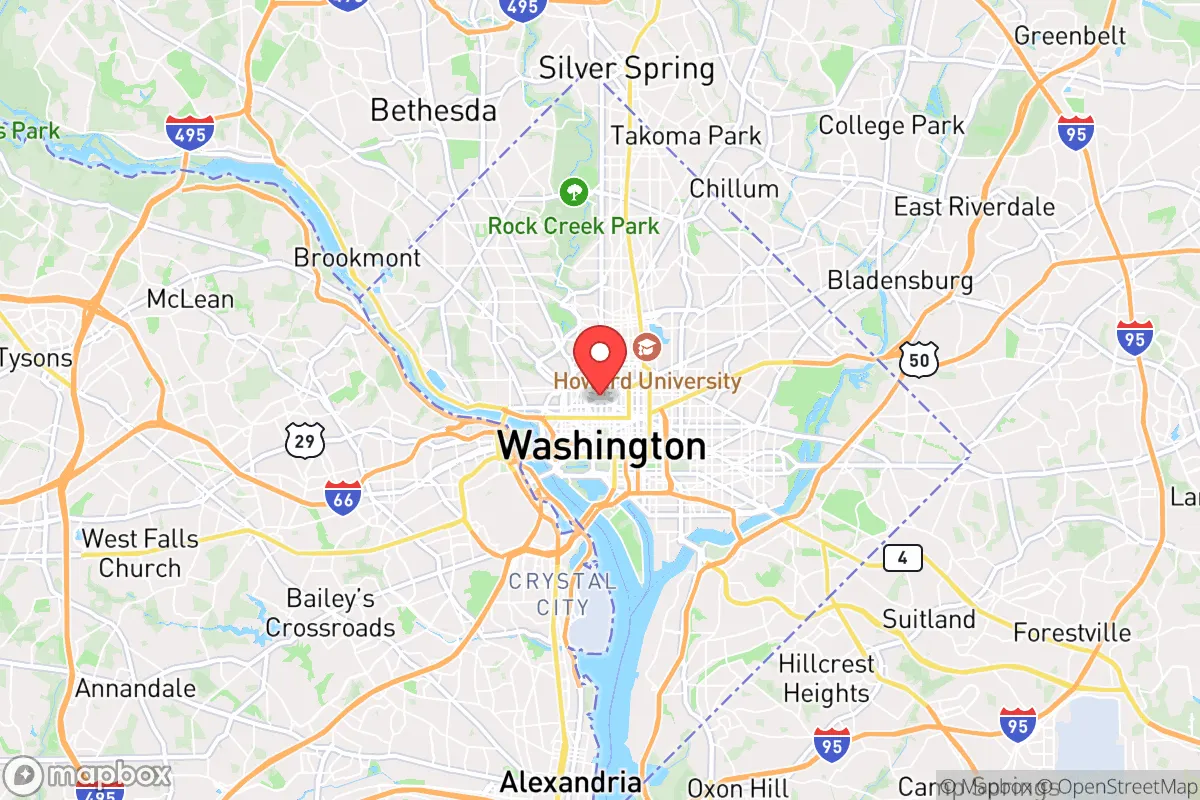
Demographics of Washington, DC
Affluence Level in Washington, DC
An upper-middle-class area. Household wealth, education levels, and homeownership run ahead of national benchmarks.
People of Washington, DC
Washington, DC is a majority-Black city (42.5%) with a large and growing White population (36.6%) and a significant Hispanic minority (11.6%), making it one of the most racially diverse major cities in the Northeast. Its 672,079 residents are among the most educated in the nation, with 63.6% holding a college degree, yet the city is marked by stark economic and geographic divides between long-established Black neighborhoods and newer, wealthier arrivals. The city’s identity is a blend of Southern heritage, federal government influence, and a rapidly gentrifying urban core that is reshaping who lives where.
How the city was settled and grew
Washington, DC was founded in 1790 as a purpose-built federal capital on land ceded from Maryland and Virginia, drawing its first residents as government clerks, laborers, and enslaved African Americans who built the Capitol and White House. The city’s early population was a mix of free Blacks, enslaved people, and white European immigrants, with Irish and German immigrants settling in Southwest DC and the old "Swampoodle" neighborhood (near today’s Union Station) in the mid-1800s. The Great Migration (1910–1970) transformed DC: hundreds of thousands of Black Americans fleeing Jim Crow in the rural South arrived, settling in Shaw, U Street, and Anacostia, creating a vibrant Black middle class and cultural hub known as "the Chocolate City." By 1950, DC was over 60% Black, a direct result of this migration and simultaneous white flight to Maryland and Virginia suburbs.
Modern era (post-1965)
The 1968 riots following Martin Luther King Jr.’s assassination devastated commercial corridors in Shaw, 14th Street, and H Street NE, accelerating Black middle-class flight to Prince George’s County, Maryland. The post-1965 Hart-Cellar Act brought a modest wave of immigrants: East/Southeast Asian communities (primarily Vietnamese and Chinese) clustered in Mount Pleasant and Columbia Heights, while Indian-subcontinent professionals (engineers, doctors) settled in upper Northwest DC and nearby Bethesda, Maryland. The city’s foreign-born share remains low at 6.7%, far below national averages, because DC’s high cost of living and limited low-skill job base deter large-scale immigration. Since 2000, the White population has surged from 30% to 36.6%, driven by young professionals and families moving into formerly Black neighborhoods like Shaw, Logan Circle, and Navy Yard, while the Black share has fallen from 60% to 42.5% as gentrification displaces long-term residents to Prince George’s County and southern Maryland.
The future
DC’s population is projected to continue its slow growth, but the city is homogenizing by income and education rather than tribalizing into distinct ethnic enclaves. The Hispanic share (11.6%) is stable, concentrated in Columbia Heights and Mount Pleasant, but these neighborhoods are rapidly gentrifying, pushing Latino families to suburban Langley Park, Maryland. The East/Southeast Asian share (2.6%) and Indian share (1.4%) are growing slowly, mostly through high-skilled immigration tied to tech and international organizations, but they remain small and dispersed. The biggest demographic story is the continued decline of the Black population, which could fall below 40% by 2035, and the rise of a White, college-educated majority in the city’s core. The next 10–20 years will likely see DC become more economically stratified: wealthy professionals in the central wards, and lower-income Black and Hispanic families pushed to the outer edges or across the Maryland line.
For someone moving in now, Washington, DC is becoming a city of two populations: a highly educated, transient professional class drawn by government and tech jobs, and a shrinking but resilient Black community with deep roots in neighborhoods like Anacostia and Congress Heights. The city offers world-class amenities and career opportunities, but newcomers should expect a rapidly changing landscape where affordability and community stability are increasingly at odds.
* Values derived from national, state, county, city and local statistics and may differ in a specific area. Last updated: 2026-04-16T00:24:42.000Z
Narrative content on this page is AI-generated and may contain mistakes. Verify any details that matter before acting on them.
ReloMaps may earn a commission from affiliate links at no extra cost to you.