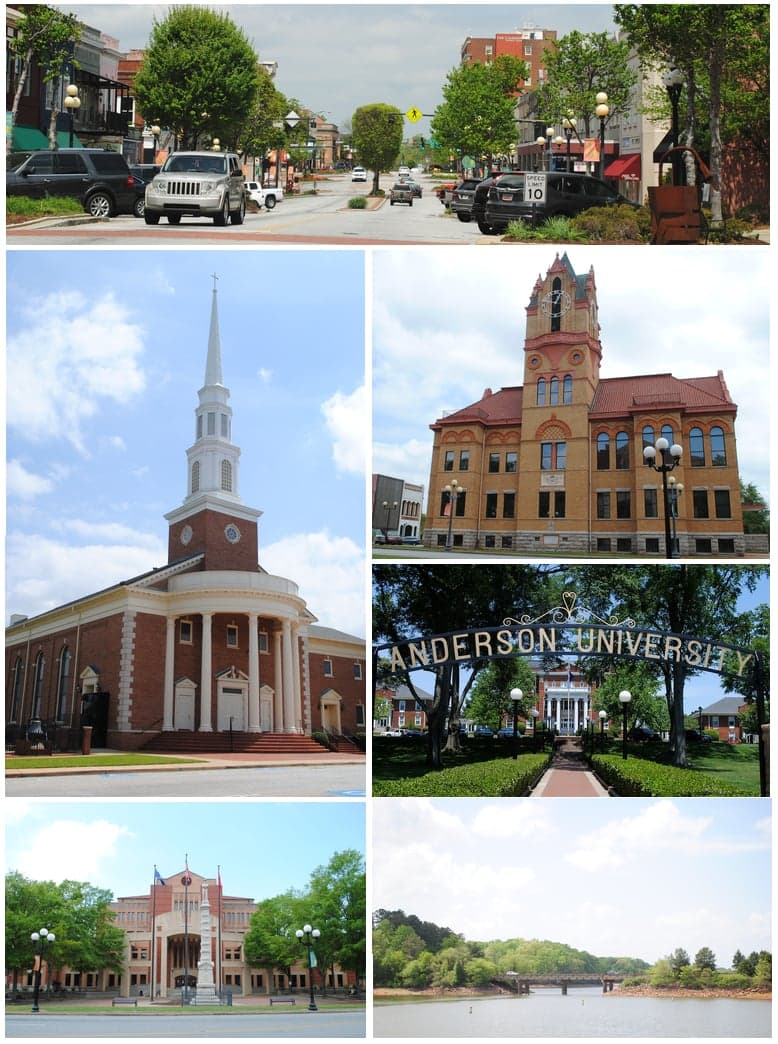
Photo: Wikipedia
Demographics of Anderson, SC
Affluence Level in Anderson, SC
A below-average socioeconomic profile. Incomes, home values, and educational attainment trail the U.S., with higher poverty and unemployment.
People of Anderson, SC
The people of Anderson, South Carolina, today form a community of roughly 29,500 residents that is predominantly white (59.3%) with a significant Black population (28.5%) and small but growing Hispanic (4.7%) and East/Southeast Asian (2.0%) communities. The city’s character is rooted in its textile-mill past and its role as a regional commercial hub, giving it a distinctly Southern, working-to-middle-class identity with a conservative political tilt. Anderson is denser than its suburban fringe, with a population density of about 1,100 people per square mile, and its residents are less college-educated (27.3%) than the national average, reflecting a blue-collar heritage that still shapes local culture.
How the city was settled and grew
Anderson was founded in 1826 as the seat of Anderson County, named after Revolutionary War hero Robert Anderson. The original population was drawn by land grants and the promise of cotton farming, with early settlers arriving from Virginia, North Carolina, and the South Carolina Lowcountry. The city’s first major growth wave came after the Civil War, when the railroad arrived in the 1850s and 1870s, transforming Anderson into a cotton-shipping center. The defining population surge, however, began in the 1880s with the rise of textile mills. Companies like the Orr Mill and the Gluck Mill built entire mill villages — Orr Village and Gluck Village — that attracted rural white families from the surrounding hills and Black families from the countryside seeking industrial work. These mill villages were racially segregated by company policy: white workers lived in the mill-owned houses, while Black workers were confined to separate neighborhoods like Belton Street and East Anderson. By 1900, Anderson’s population had reached about 4,000, and the textile boom continued through the 1920s, drawing additional waves of white Appalachian migrants and Black laborers from the Deep South. The city’s historic core — Downtown Anderson — was built by these mill workers and their families, with churches, schools, and commercial districts reflecting the racial divide.
Modern era (post-1965)
The post-1965 era brought significant demographic change to Anderson, driven by the decline of the textile industry and the opening of new economic opportunities. The Immigration and Nationality Act of 1965 had a modest direct effect on Anderson — the foreign-born population today is only 2.8% — but it did enable the arrival of small Hispanic and East/Southeast Asian communities. Hispanic residents, now 4.7% of the population, began arriving in the 1990s and 2000s, drawn by construction and service jobs in the growing suburban fringe. They settled primarily in North Anderson and along the Clemson Boulevard corridor, where affordable housing and proximity to retail employment made entry possible. East/Southeast Asian communities (2.0%) — mostly Vietnamese and Korean families — arrived in smaller numbers, often as professionals or small-business owners, and concentrated in Midtown and near the AnMed Health Medical Center. The Indian-subcontinent population (0.4%) is tiny and largely tied to professional roles at nearby Clemson University or the medical sector. Domestically, the 1970s through 1990s saw white flight from the city center to newer subdivisions like Centerville and Piedmont, leaving the historic mill villages and East Anderson predominantly Black. The Black population share has remained stable at around 28-30% since 2000, while the white share has declined from about 65% to 59.3% as Hispanic and Asian groups have grown. The city’s racial geography is now clearly defined: white residents are concentrated in the western and northern suburbs, Black residents in the eastern and central historic neighborhoods, and Hispanic residents in the northern commercial corridor.
The future
Anderson’s population is slowly diversifying, but the pace is moderate. The Hispanic share is projected to grow from 4.7% to perhaps 7-8% by 2035, driven by continued service-sector demand and family reunification. The East/Southeast Asian and Indian populations are likely to remain small, plateauing at 2-3% combined, as the city lacks the high-tech job base that attracts larger Asian communities to Greenville or Charlotte. The white and Black shares are expected to converge slightly — white declining toward 55-57% and Black holding steady near 28% — as the city’s overall growth (projected at 0.5-1% annually) comes disproportionately from Hispanic and mixed-race households. Anderson is not tribalizing into distinct enclaves in the way that larger metros are; instead, it is slowly homogenizing into a more diverse but still majority-white Southern city. The historic mill villages like Orr Village and Gluck Village are seeing reinvestment and some gentrification, attracting younger white professionals priced out of Greenville, while East Anderson remains predominantly Black and lower-income. The Clemson Boulevard corridor is becoming the city’s most diverse area, with Hispanic-owned businesses and Asian-run convenience stores alongside national chains.
For someone moving to Anderson now, the city is becoming a more varied place than its textile-mill past suggests — still conservative and family-oriented, but with a growing Hispanic presence and a stable Black community that gives it a genuinely Southern character. The neighborhoods you choose will largely determine your experience: historic mill villages for walkability and character, North Anderson for affordability and diversity, or the suburban fringe for newer housing and schools. The population is heading toward a modestly more diverse, slightly more educated future, but Anderson will remain a small, slow-growing city where community ties and local institutions — churches, schools, the county fair — matter more than rapid demographic change.
* Values derived from national, state, county, city and local statistics and may differ in a specific area. Last updated: 2026-04-24T02:49:45.000Z
Narrative content on this page is AI-generated and may contain mistakes. Verify any details that matter before acting on them.
ReloMaps may earn a commission from affiliate links at no extra cost to you.