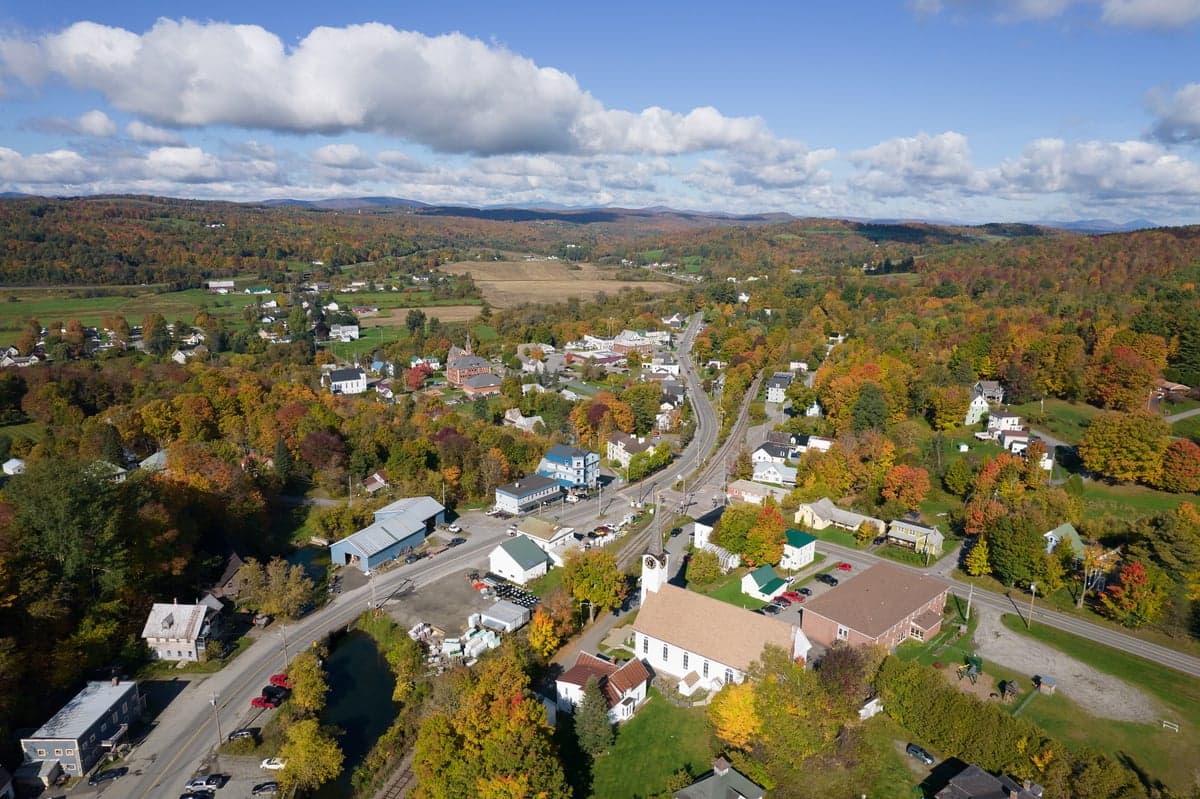
Photo: Wikipedia
Demographics of Barton, VT
Affluence Level in Barton, VT
A below-average socioeconomic profile. Incomes, home values, and educational attainment trail the U.S., with higher poverty and unemployment.
People of Barton, VT
The people of Barton, Vermont, today number 697, forming a small, tightly-knit community where 81.5% of residents identify as White and a notable 17.9% hold a college degree—a figure that reflects a modest but present professional class. The population is older than the state median, with a foreign-born share of 5.6% that slightly exceeds the Orleans County average, driven largely by a small but established Hispanic (4.0%) and Black (6.6%) presence. Distinctive markers include a strong sense of local independence, a reliance on seasonal tourism and manufacturing, and a demographic profile that is slowly diversifying from its historic homogeneity. The city’s character is one of quiet resilience, shaped by waves of settlement that have left their mark on specific neighborhoods.
How the city was settled and grew
Barton was chartered in 1789 as part of a land grant system that drew Yankee settlers from southern New England, primarily farmers seeking fertile land along the Barton River. The earliest arrivals clustered around what is now Barton Village, the historic core along the river, where they built mills and small farms. The arrival of the railroad in the 1850s spurred a second wave, bringing French-Canadian laborers who settled in the East Side district, near the rail depot and the granite quarries that became the area’s primary employer. By 1900, a small Irish Catholic community had formed in the West Barton area, working in the mills and on the railroad. The population peaked around 1,200 in the 1920s, driven by the granite industry and a brief dairy boom, before declining as mechanization reduced farm labor needs. The South End, near the current Route 5 corridor, developed as a working-class neighborhood for quarry and mill workers through the mid-20th century.
Modern era (post-1965)
The post-1965 period brought gradual demographic change, though Barton remained overwhelmingly White. The closure of several granite quarries in the 1970s led to population loss, with many younger residents leaving for Burlington or out of state. The 1980s and 1990s saw a small influx of Hispanic families, primarily from Mexico and Central America, who found work in the region’s dairy farms and food processing plants. These families concentrated in the Barton Village rental stock and in the Orleans Street corridor, where affordable housing was available. The Black population, now 6.6%, grew modestly after 2000, driven by a mix of domestic migration from southern states and a small number of African immigrants drawn to the area’s low cost of living. The Lake Region area, near Crystal Lake, attracted a handful of out-of-state retirees and remote workers, adding to the college-educated share. The Asian population (East/Southeast Asian) remains negligible at 0.3%, with no Indian subcontinent presence recorded. The foreign-born share of 5.6% is almost entirely Hispanic and Black, making Barton more diverse than many neighboring towns but still far from the state’s urban centers.
The future
Barton’s population is projected to remain stable or decline slightly over the next decade, as the aging cohort of long-term residents passes and out-migration of young adults continues. The Hispanic and Black communities are likely to grow slowly, as families already in the area expand and a trickle of new arrivals seek affordable housing in the Barton Village and South End neighborhoods. However, the city is not experiencing rapid diversification; the White share will likely remain above 75% for the foreseeable future. The college-educated share may rise modestly as remote workers and retirees from southern New England discover the area’s low property taxes and lake access, particularly around Crystal Lake Shores. There is no evidence of tribalization into distinct ethnic enclaves—Barton is too small for that—but the East Side and West Barton areas retain a subtle class divide, with the former slightly more working-class and the latter more mixed-income. The biggest wildcard is the potential for new manufacturing or logistics investment along the I-91 corridor, which could attract a more diverse workforce.
Barton is becoming a place where a small, stable core of long-term residents is slowly being joined by a slightly more diverse and educated population, but change is measured in decades, not years. For someone moving in now, the city offers a quiet, affordable base with a strong sense of local identity, but limited economic opportunity and a demographic profile that will remain predominantly White and older. The neighborhoods of Barton Village and the South End are the most accessible for newcomers, while Crystal Lake Shores and West Barton offer more established, quieter settings.
* Values derived from national, state, county, city and local statistics and may differ in a specific area. Last updated: 2026-04-30T13:57:35.000Z
Narrative content on this page is AI-generated and may contain mistakes. Verify any details that matter before acting on them.
ReloMaps may earn a commission from affiliate links at no extra cost to you.