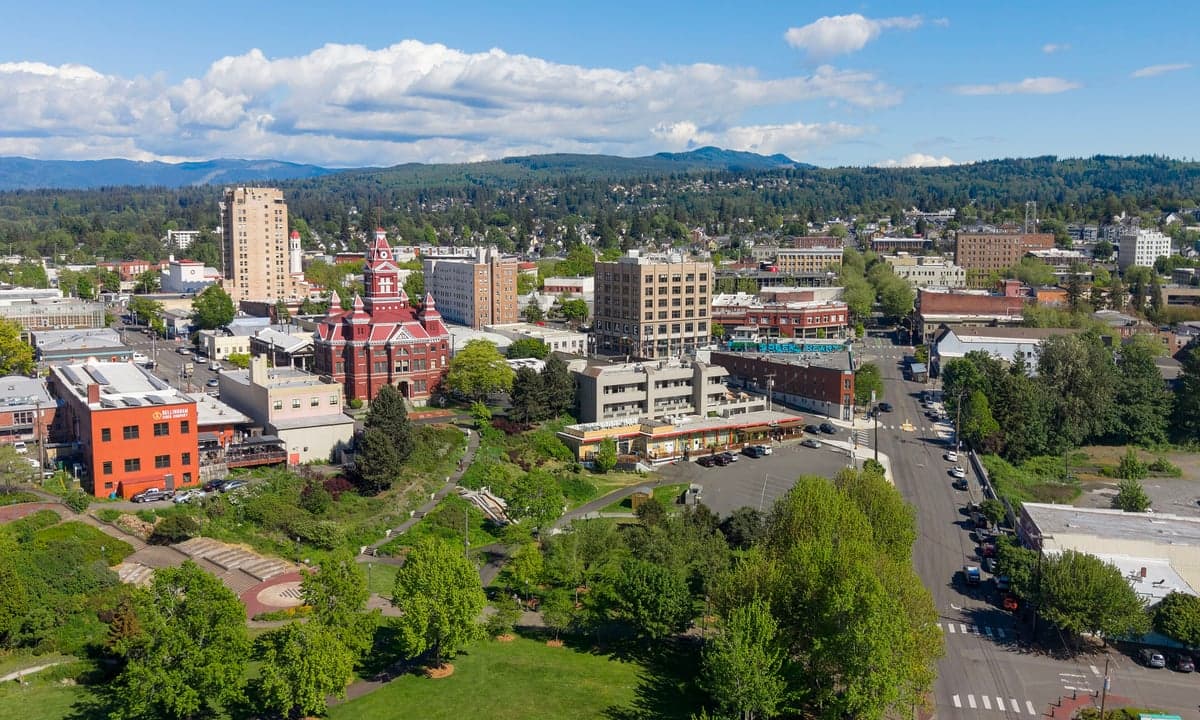
Photo: Wikipedia
Demographics of Bellingham, WA
Affluence Level in Bellingham, WA
A middle-class area roughly in line with national averages across income, home values, education, and employment.
People of Bellingham, WA
The people of Bellingham, Washington today number 92,367, forming a predominantly white (76.3%) and highly educated (46.5% college degree) population that is notably less diverse than the national average. The city’s foreign-born share sits at just 4.0%, roughly one-third the U.S. average, and its largest minority group is Hispanic residents at 10.0%, followed by East/Southeast Asian communities at 4.3% and Indian-subcontinent residents at 1.1%. Bellingham’s identity is shaped by its role as a regional college town (Western Washington University), a gateway to outdoor recreation, and a historically working-class port that has gentrified significantly since the 1990s.
How the city was settled and grew
Bellingham’s original population was drawn by the region’s natural resources. The area was inhabited for millennia by Coast Salish peoples, primarily the Lummi and Nooksack tribes, who fished and traded along Bellingham Bay. American settlement began in the 1850s after the Treaty of Point Elliott (1855) forced tribal land cessions. The first permanent white settlers arrived via the Whatcom Trail, a rough route from Fort Hope, Canada, and established a small logging and coal-mining outpost. The discovery of coal in the nearby Sehome area (now downtown) in the 1850s sparked the first real population wave, drawing Welsh, Irish, and Scandinavian miners. By the 1880s, the arrival of the Northern Pacific Railway turned Bellingham into a major lumber and salmon-canning hub, attracting a second wave of Scandinavian immigrants (Swedes, Norwegians, Finns) who settled in the Fairhaven and Whatcom neighborhoods. These workers built the city’s original street grid and the iconic Fairhaven Hotel. A third wave came during the early 1900s as the city’s pulp and paper mills expanded, drawing Finnish and Italian laborers to the Birchwood and Columbia neighborhoods. By 1950, Bellingham’s population was over 90% white, overwhelmingly of Northern European descent, with a small Japanese-American community centered in the Lettered Streets district that was largely displaced by wartime internment.
Modern era (post-1965)
The 1965 Hart-Cellar Act had minimal impact on Bellingham compared to larger West Coast cities. The city’s foreign-born share remained below 5% through the 1990s. The major demographic shift after 1965 was domestic: the founding of Western Washington University (WWU) in 1899, but its expansion to a comprehensive university in the 1970s drew a steady stream of faculty, students, and educated professionals from elsewhere in Washington and California. This influx settled primarily in the South Hill and Edgemoor neighborhoods, near the WWU campus, and in the York district, a historic streetcar suburb that became a magnet for young families and academics. The Hispanic population grew from negligible to 10.0% today, driven largely by agricultural labor in Whatcom County’s berry and dairy farms. Most Hispanic residents live in the Birchwood and Roosevelt neighborhoods, where lower housing costs and proximity to farm jobs concentrated the community. The East/Southeast Asian population (4.3%) is primarily of Chinese, Korean, and Vietnamese descent, many connected to WWU’s international student program or to the region’s tech-adjacent industries. The Indian-subcontinent population (1.1%) is smaller and more recent, largely professionals in healthcare and tech who have settled in the Barkley district and newer subdivisions near the waterfront. The Black population remains tiny at 1.2%, with no single concentrated neighborhood.
The future
Bellingham’s population is trending older and more expensive. The city’s median age has risen to 33.2, and housing costs have increased over 60% since 2015, pushing younger families and lower-income residents to outlying towns like Ferndale and Lynden. The foreign-born share is expected to grow slowly, likely reaching 6-7% by 2035, driven by continued Hispanic in-migration for agricultural work and a modest increase in Asian and Indian professionals tied to WWU and the region’s growing clean-energy sector. The city is not tribalizing into distinct ethnic enclaves; rather, it is homogenizing by income. The white, college-educated population is consolidating in the South Hill and Edgemoor neighborhoods, while Hispanic and working-class white residents are increasingly concentrated in Birchwood and Roosevelt. The East/Southeast Asian and Indian communities are too small to form distinct enclaves and are dispersed across the city. The next decade will likely see Bellingham become whiter and wealthier at the core, with diversity pushed to the periphery.
For a conservative-leaning individual or family considering relocation, Bellingham is a politically progressive city (Whatcom County voted +30 Democratic in 2024) with a population that is culturally homogeneous despite modest Hispanic and Asian growth. The city’s high education levels and low crime rate (2.3 violent crimes per 1,000) appeal to professionals, but the limited racial diversity and high cost of living mean newcomers should expect a predominantly white, liberal-leaning environment where community is defined more by outdoor lifestyle and university affiliation than by ethnic identity.
* Values derived from national, state, county, city and local statistics and may differ in a specific area. Last updated: 2026-04-21T11:02:35.000Z
Narrative content on this page is AI-generated and may contain mistakes. Verify any details that matter before acting on them.
ReloMaps may earn a commission from affiliate links at no extra cost to you.