Photo: Wikipedia
Quality of Life in Bellingham, WA
Above-average quality of iife. The area offers a reasonable cost of living, decent mobility, and a mix of neighborhood amenities.
What does Quality of Life tell us?
Quality of Life blends cost of living, nearby amenities, socioeconomic signals, and neighborhood character. City-level scores represent the whole municipality; individual neighborhoods can differ.
What does this tell us?
Quality of Life blends cost of living, nearby amenities, socioeconomic signals, and neighborhood character. City-level scores represent the whole municipality; individual neighborhoods can differ.
Cost of Living
58% above national average
The Real Cost of Living in Bellingham, WA for 2026
| Tier | Individual | Family (4) |
|---|---|---|
| Survival | $24k | $44k |
| Comfortable | $88k | $129k |
| Luxury | $119k+ | $184k+ |
| Elite (Top 5%) | $152k+ | $235k+ |
51%
The Area Signal
A metric tracking the socioeconomic signals of the area.
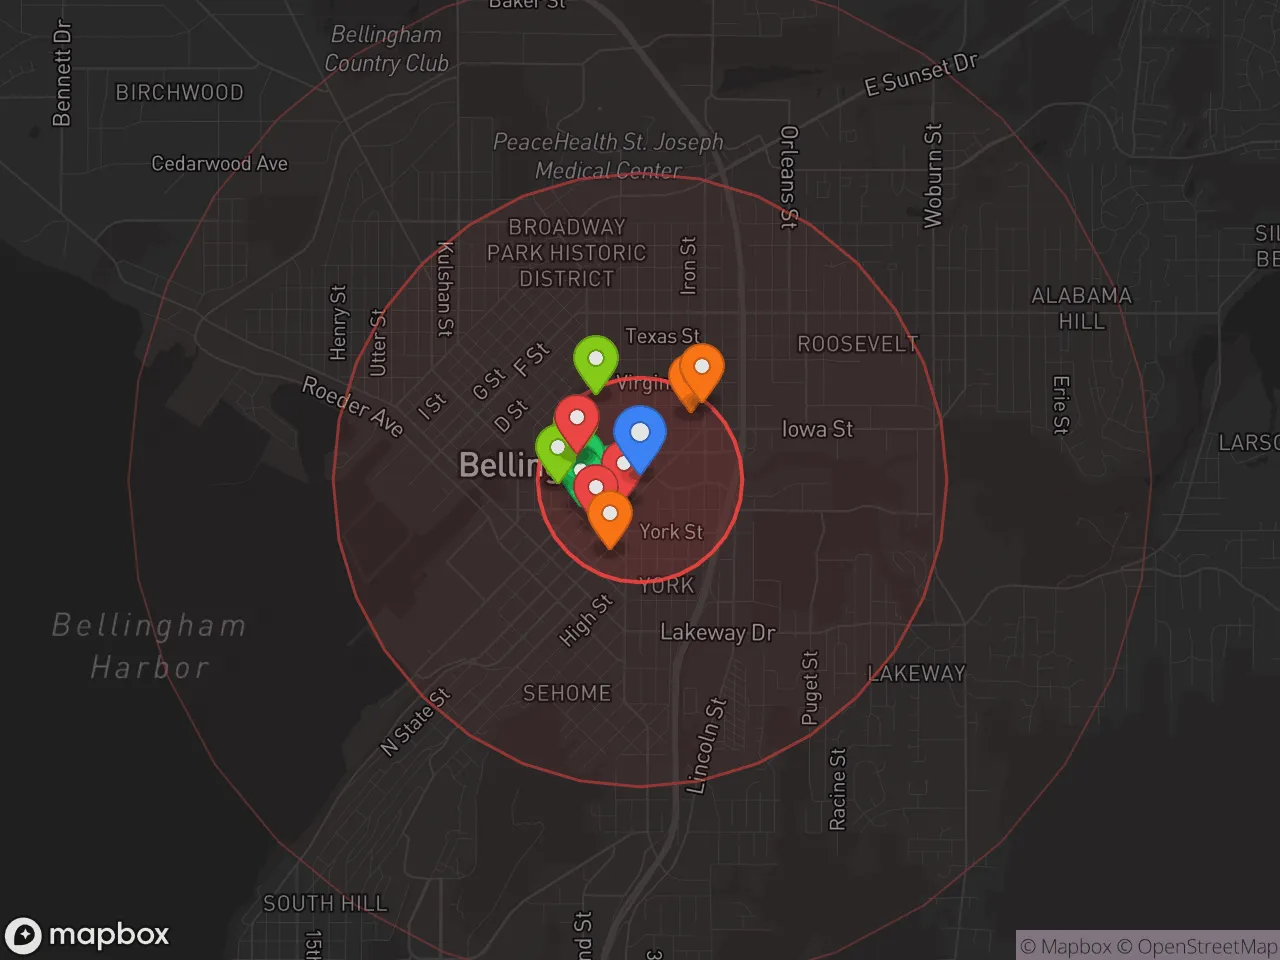
Hobbies
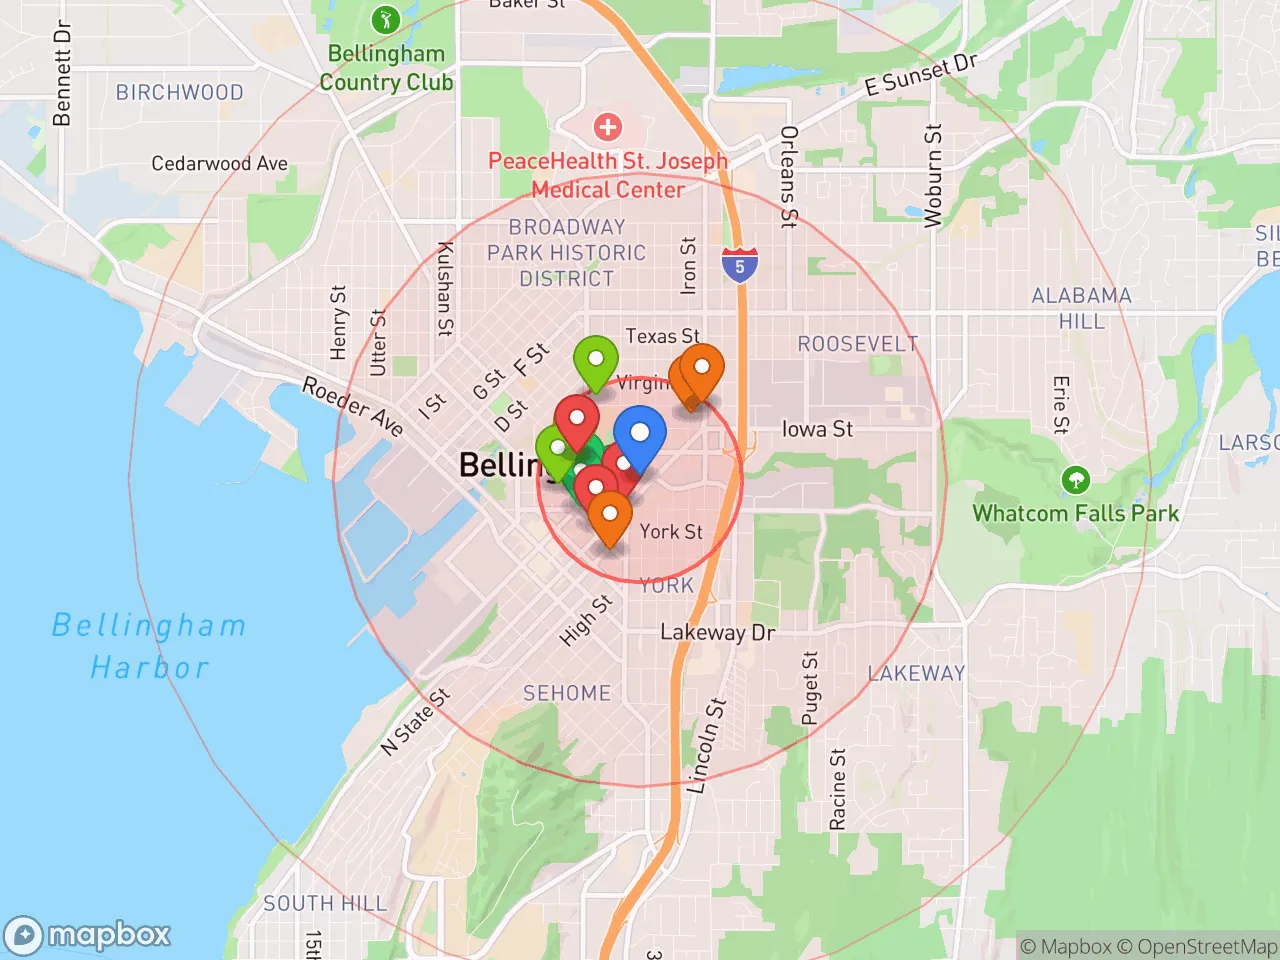
Explore the areaGroceries
8 within 10 miles
Gas
20 within 10 miles
Hospital
3 within 20 miles
Airport
SEA — Seattle–Tacoma International
Post Office
USPS — Bellingham, WA
Critical Amenities
Quality-of-Life Analysis
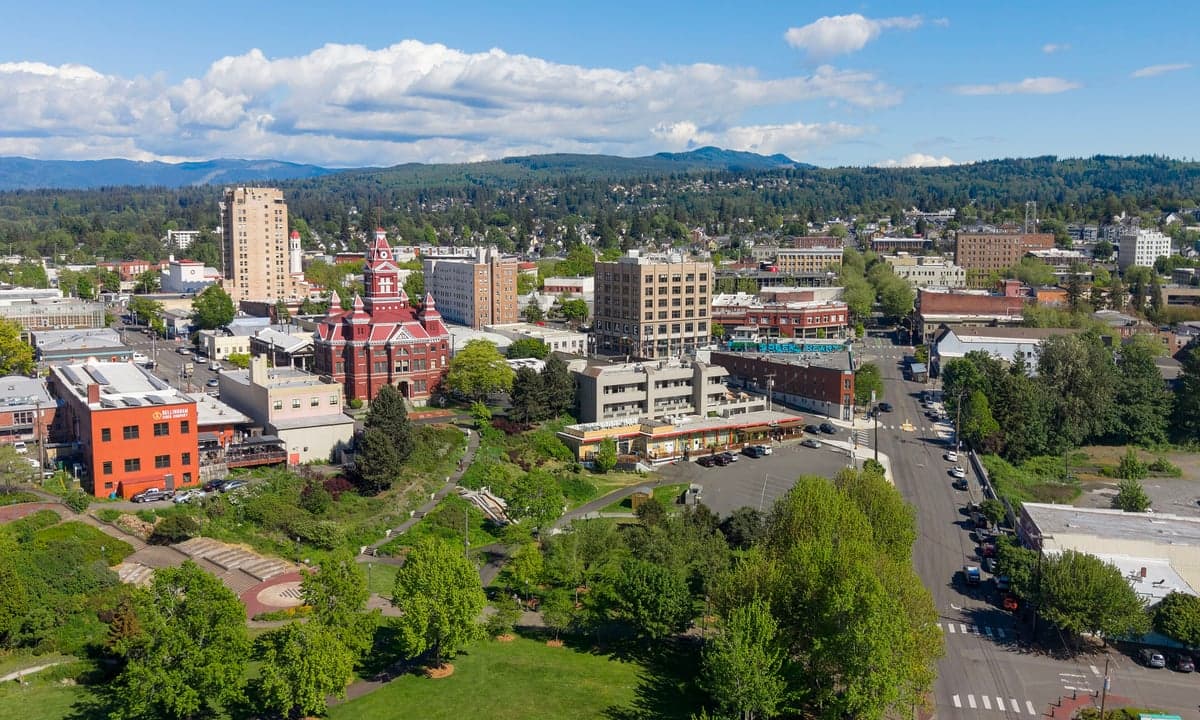
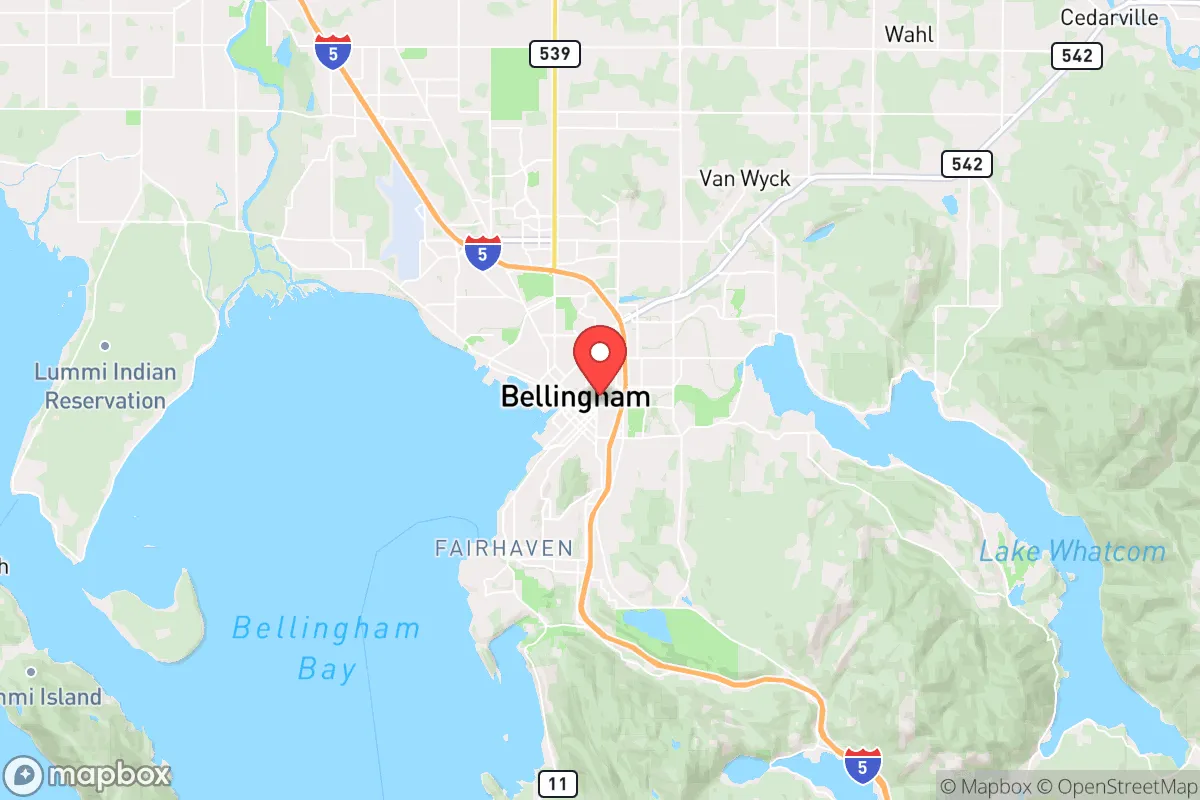
Bellingham, Washington, is an affluent mid-sized city of roughly 93,000 residents, anchored by Western Washington University and a robust outdoor-recreation economy. The population skews younger and more educated than the state average, with a median age of 34.7 and over 40% of adults holding a bachelor’s degree or higher. The city’s political lean is solidly Democratic—Whatcom County voted +30 for Biden in 2020—and its culture blends progressive environmentalism with a blue-collar maritime heritage centered on the Bellingham Bay waterfront.
Cost of living and housing affordability compared to Seattle and Vancouver, BC
Bellingham’s cost of living index sits at 158 (100 = U.S. average), making it roughly 58% more expensive than the typical American city but still significantly cheaper than Seattle (index ~173) and Vancouver, BC (index ~210+). The median home value is $577,400, which is about $100,000 below the Seattle metro median but nearly double the national figure. Renters face a median monthly rent of $1,478, compared to Seattle’s $2,100 and Vancouver’s $2,800 CAD. The average commute time is a short 18.7 minutes, well under the national average of 26 minutes, thanks to the city’s compact layout and limited sprawl. However, wages have not kept pace with housing costs: the median household income of $68,000 is below the state median of $91,000, meaning many residents—especially service workers and recent graduates—are cost-burdened. For buyers, the market is competitive but less frenzied than Seattle’s; a $577,400 home in Bellingham typically requires a household income of roughly $110,000 to avoid being cost-burdened, per standard lending ratios.
What daily life is like for families and outdoor enthusiasts
Bellingham’s daily rhythm is defined by its natural setting between the Salish Sea and Mount Baker. The city operates a highly rated public school system—Bellingham Public Schools consistently ranks in Washington’s top 20% for academic outcomes—and the presence of Western Washington University provides a steady stream of cultural events, lectures, and Division II athletics. Amenities include the historic Fairhaven district with its independent bookstores and farm-to-table restaurants, the Bellingham Farmers Market (one of the state’s largest), and over 90 miles of city-maintained trails. For outdoor access, residents are 20 minutes from the Mount Baker Ski Area’s world-class snowpack and 10 minutes from the San Juan Islands ferry terminal. The city’s walkability score of 52 is moderate, but the downtown core and Fairhaven are highly pedestrian-friendly. Traffic is minimal outside of I-5 corridor congestion during summer tourist season. The main trade-offs are limited nightlife (most bars close by midnight) and a relatively small job market outside of healthcare, education, and retail.
Bellingham is best suited for people who prioritize outdoor recreation and a slower pace over urban career opportunities. Remote workers, retirees with equity from higher-cost markets, and families who value small schools and low commute times will find the city’s trade-offs worthwhile. Those seeking high-paying tech jobs, diverse nightlife, or a truly affordable housing market should look elsewhere—Seattle or Vancouver for the former, and more inland Washington towns like Mount Vernon or Bellingham’s own outlying county for the latter.
Crime in Bellingham, WA
Generally safer than 61% of comparable U.S. locations.
Violent CrimeViolent Crime Analysis
Property CrimeProperty Crime Analysis
Crime Analysis
Bellingham, Washington, reports a violent crime rate of 258 incidents per 100,000 residents and a property crime rate of 3,255.9 per 100,000. While the violent crime figure sits slightly below the national average, the property crime rate is significantly elevated, placing the city in a higher-risk category for theft and burglary. The overall safety picture is complicated by the region's progressive judicial philosophy, which prioritizes offender rehabilitation over incarceration, a factor that directly contributes to higher recidivism and more criminals on the street.
Crime in context
Compared to Washington state averages, Bellingham's violent crime rate is roughly on par, but its property crime rate is approximately 30% higher than the state figure. Nationally, the city's property crime rate is nearly double the U.S. median. This disparity is a direct consequence of local policies, including low bail requirements and prosecutorial diversion programs championed by progressive district attorneys. These policies, while intended to reduce jail populations, have resulted in repeat property offenders cycling through the system quickly, undermining public safety and victim confidence. The city's proximity to the Canadian border also creates a unique dynamic, with some property crime linked to cross-border theft rings.
What residents experience
For residents, the most tangible safety concern is property crime. Vehicle break-ins, bicycle theft, and package theft are pervasive, particularly in neighborhoods near Western Washington University and downtown. The Bellingham Police Department's clearance rate for property crime hovers around 15%, meaning most thefts go unsolved. Violent crime is less common but not absent, with incidents concentrated in specific areas and often tied to drug-related disputes or homelessness. The progressive approach of Whatcom County's justice system—which includes a presumption against pre-trial detention for non-violent offenses—means that even individuals arrested for theft or drug possession are frequently released within hours, creating a sense of impunity among offenders and frustration among law-abiding residents.
Neighborhood-level variation
Safety varies significantly by neighborhood. The Lettered Streets and Columbia neighborhoods experience the highest rates of property crime due to density and foot traffic. The South Hill and Edgemoor areas are generally safer, with lower crime rates and more active neighborhood watch programs. However, no part of Bellingham is immune to the effects of the region's lenient justice policies, as offenders travel freely across the city. For those considering relocation, the trade-off is clear: Bellingham offers natural beauty and a vibrant community, but residents must accept a higher baseline risk of property crime and a judicial system that often prioritizes offender rights over victim justice.
* Values derived from national, state, county, city and local statistics and may differ in a specific area. Last updated: 2026-04-21T11:02:35.000Z
Narrative content on this page is AI-generated and may contain mistakes. Verify any details that matter before acting on them.
ReloMaps may earn a commission from affiliate links at no extra cost to you.