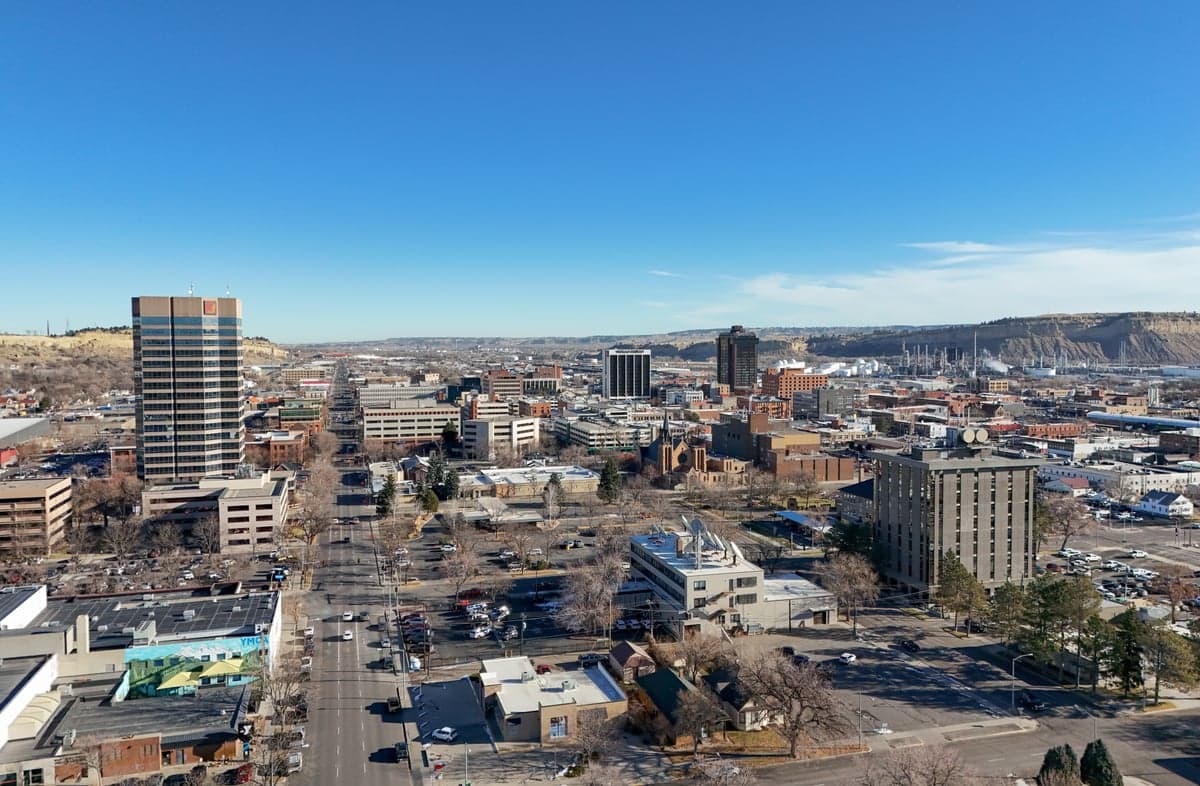
Photo: Wikipedia
Demographics of Billings, MT
Affluence Level in Billings, MT
A middle-class area roughly in line with national averages across income, home values, education, and employment.
People of Billings, MT
Billings, Montana, is a city of roughly 118,000 residents that remains overwhelmingly white (83.2%) and native-born (only 1.0% foreign-born), giving it a demographic profile far more homogeneous than the national average. Its people are characterized by a pragmatic, working-to-middle-class ethos rooted in the region's energy, agriculture, and healthcare industries, with a notable 37.0% holding a college degree. The city's identity is less about ethnic diversity and more about a shared frontier resilience, though a small but growing Hispanic population (7.2%) and tiny East/Southeast Asian (0.8%) and Black (0.5%) communities add modest texture. For a conservative-leaning relocator, Billings offers a place where traditional community structures remain intact, and the population is stable rather than in flux.
How the city was settled and grew
Billings was founded in 1882 as a railroad town, named after Northern Pacific Railway president Frederick H. Billings. The original population was drawn by the promise of work on the railroad and the subsequent boom in coal mining, ranching, and sugar beet farming. The first wave of settlers were largely Anglo-American homesteaders from the Midwest and Upper Plains, along with a significant number of German and Scandinavian immigrants who came directly from Europe to work the land and the rails. These groups built the city's earliest neighborhoods: the South Side, originally a working-class district near the rail yards, and the Heights (officially Lockwood), which grew as a blue-collar enclave for railroad and refinery workers. A smaller wave of Italian and Irish laborers also settled near the downtown core, in what is now the North Elevation area, establishing Catholic parishes and fraternal organizations that still anchor the community. By the mid-20th century, Billings was a classic Northern Plains hub—overwhelmingly white, Protestant, and politically conservative—with a population that had grown to about 50,000 by 1960.
Modern era (post-1965)
The post-1965 era brought only modest demographic change to Billings, largely because the city's economy—anchored by oil refining, agriculture, and later healthcare—did not attract the large-scale immigration seen in coastal cities. The Hispanic population, now 7.2%, began to grow in the 1970s and 1980s, driven by migrant labor in the sugar beet fields and meatpacking plants. These families settled primarily in the South Side and parts of West Billings, where affordable housing and proximity to industrial jobs created a small but stable Latino corridor. The East/Southeast Asian community (0.8%) arrived in two thin waves: a handful of Vietnamese refugees in the late 1970s, followed by a small number of Filipino healthcare workers recruited by Billings' expanding medical sector in the 2000s. They are scattered across the city, with no single ethnic enclave, though a cluster of Asian-owned businesses exists near the intersection of Grand Avenue and 24th Street West. The Black population (0.5%) remains tiny, largely composed of military-affiliated families stationed at nearby Malmstrom Air Force Base or professionals in the energy sector. Suburbanization after 1980 pushed many white families into newer developments in West End and Shiloh, creating a socio-economic divide between the older, more diverse South Side and the newer, wealthier, and whiter western neighborhoods. The Indian subcontinent population is statistically zero, and Arab communities are negligible, making Billings one of the least ethnically diverse cities of its size in the United States.
The future
Billings' population is projected to grow modestly—perhaps 10-15% over the next two decades—driven by domestic in-migration from other Western states, particularly California and Washington, as remote workers and retirees seek lower costs and conservative governance. This influx is likely to be overwhelmingly white and college-educated, reinforcing the city's existing demographic character. The Hispanic population is expected to continue its slow growth, potentially reaching 10-12% by 2040, but will likely assimilate into the broader community rather than forming distinct ethnic enclaves. The East/Southeast Asian and Black populations will probably remain small, sustained by targeted recruitment in healthcare and education. The city is not tribalizing into ethnic enclaves; instead, it is homogenizing along class lines, with the West End and Shiloh areas becoming more affluent and the South Side and Heights remaining working-class. For a conservative-leaning relocator, this means Billings will likely stay a place where English is the dominant language, traditional family structures are the norm, and the pace of cultural change is slow.
For someone moving to Billings today, the city offers a stable, predictable environment where the population is growing slowly, diversity is limited, and the dominant culture remains rooted in Western independence and conservative values. The neighborhoods to watch are the West End for new development and the South Side for affordable entry points, while the Heights and North Elevation retain their historic blue-collar character. This is not a city undergoing rapid transformation; it is a city that knows what it is and is likely to stay that way.
* Values derived from national, state, county, city and local statistics and may differ in a specific area. Last updated: 2026-04-19T06:53:26.000Z
Narrative content on this page is AI-generated and may contain mistakes. Verify any details that matter before acting on them.
ReloMaps may earn a commission from affiliate links at no extra cost to you.