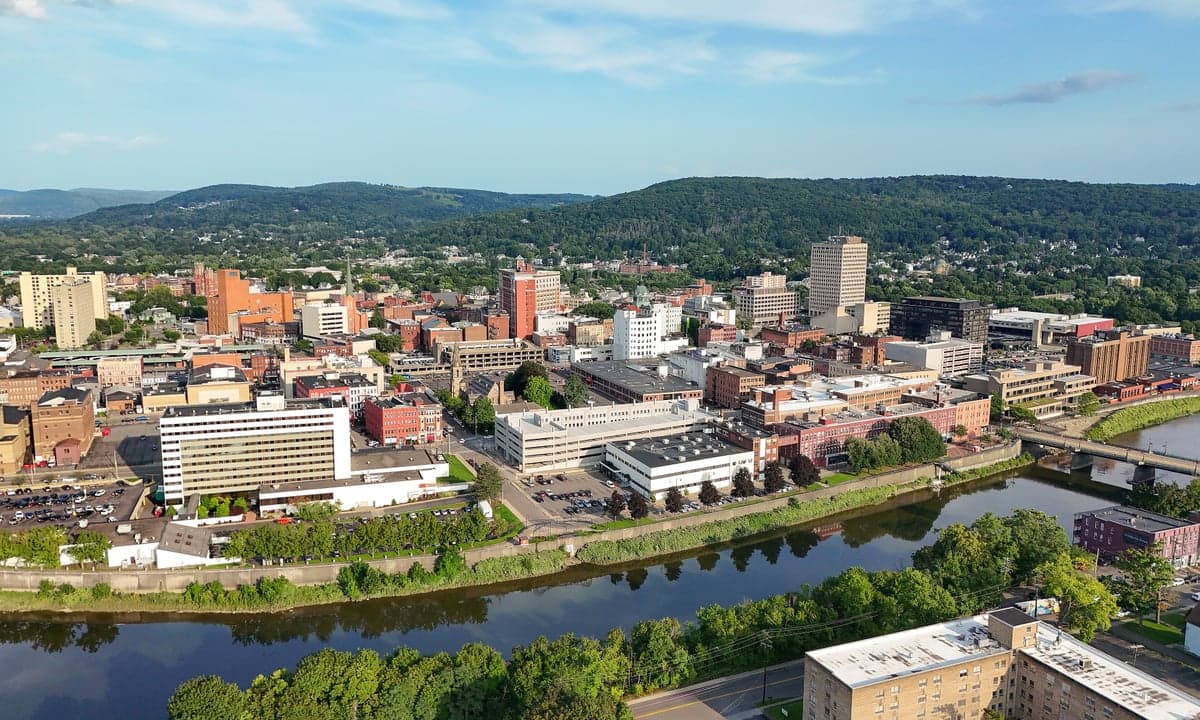
Photo: Wikipedia
Demographics of Binghamton, NY
Affluence Level in Binghamton, NY
A below-average socioeconomic profile. Incomes, home values, and educational attainment trail the U.S., with higher poverty and unemployment.
People of Binghamton, NY
The people of Binghamton, New York today form a small, historically rooted city of 47,357 residents, characterized by a predominantly white population (65.7%) with significant Black (13.0%) and Hispanic (8.8%) communities, alongside growing East/Southeast Asian (3.5%) and Indian-subcontinent (3.2%) populations. The city retains a working-class, industrial-era identity, with a college-educated rate of 30.8% and a foreign-born share of 5.6% that reflects modest but steady immigration. Binghamton’s population is older and more settled than the national average, with a density of roughly 3,400 people per square mile, giving it a tight-knit, neighborhood-oriented feel where distinct ethnic enclaves still echo the waves of migration that built the city.
How the city was settled and grew
Binghamton’s population history begins with its founding in the early 1800s as a transportation and manufacturing hub at the confluence of the Susquehanna and Chenango Rivers. The original settlers were largely Yankee migrants from New England and New York’s Hudson Valley, drawn by the Erie Canal’s extension and later the railroad. By the mid-19th century, the city’s industrial boom—anchored by cigar-making, shoe factories, and later Endicott-Johnson’s shoe empire—attracted waves of European immigrants. Irish and German laborers arrived first, settling in the First Ward (the city’s oldest neighborhood, near the riverfront) and the West Side, building the Catholic churches and social halls that still define those areas. Italian immigrants followed in the 1880s-1910s, concentrating in Little Italy (centered around Court Street) and the East Side, where they worked in the shoe factories and established a dense network of family-run businesses. Eastern European Jews arrived in the early 1900s, settling in the South Side (along Main Street) and contributing to the city’s commercial and cultural life. By 1920, Binghamton’s population peaked at over 66,000, a mix of native-born Yankees and European ethnics that gave the city a distinct, blue-collar character.
Modern era (post-1965)
The post-1965 period brought significant demographic shifts as Binghamton’s industrial base declined. The Hart-Cellar Act opened immigration from non-European countries, while domestic out-migration of white families to suburbs like Vestal and Endwell accelerated. Black residents, who had been a small presence since the Great Migration, grew in number as manufacturing jobs faded; they concentrated in the North Side (around Chenango Street) and parts of the First Ward, forming a community that now makes up 13.0% of the city’s population. Hispanic residents, primarily Puerto Rican and Dominican, began arriving in the 1970s and 1980s, settling in the West Side and South Side, where they now account for 8.8% of the population. East/Southeast Asian communities (Chinese, Vietnamese, Korean) grew more slowly, often tied to Binghamton University’s presence; they are dispersed but visible in the West Side and near the university corridor. Indian-subcontinent residents (3.2%) are a newer, more professional cohort, many employed in tech and healthcare, and tend to live in the West Side and newer developments on the city’s outskirts. The city’s white population has declined from over 90% in 1970 to 65.7% today, a trend driven by suburban flight and an aging native-born cohort.
The future
Binghamton’s population is heading toward modest diversification, but the city is not homogenizing or tribalizing into rigid enclaves. The foreign-born share (5.6%) is below the national average, and immigration is plateauing rather than accelerating. East/Southeast Asian and Indian communities are growing slowly, driven by Binghamton University’s graduate programs and regional healthcare jobs, but they are assimilating into existing neighborhoods rather than forming new ethnic clusters. The Black and Hispanic populations are stable, with some out-migration to suburbs. The biggest demographic trend is aging and shrinkage: the city lost 5% of its population between 2010 and 2020, and the median age (around 35) is rising as young adults leave for larger metros. Over the next 10-20 years, Binghamton will likely become slightly more diverse but remain predominantly white and older, with a shrinking tax base and a growing need for services for an aging population.
For someone moving in now, Binghamton is becoming a quieter, more affordable, and more diverse version of its industrial past—a place where historic ethnic neighborhoods still matter but are blending into a broader, older, and more stable community. The city offers low housing costs and a strong sense of place, but population decline and limited economic growth mean newcomers should expect a slow-paced, family-oriented environment rather than a dynamic, expanding one.
* Values derived from national, state, county, city and local statistics and may differ in a specific area. Last updated: 2026-05-01T00:47:30.000Z
Narrative content on this page is AI-generated and may contain mistakes. Verify any details that matter before acting on them.
ReloMaps may earn a commission from affiliate links at no extra cost to you.