Photo: Wikipedia
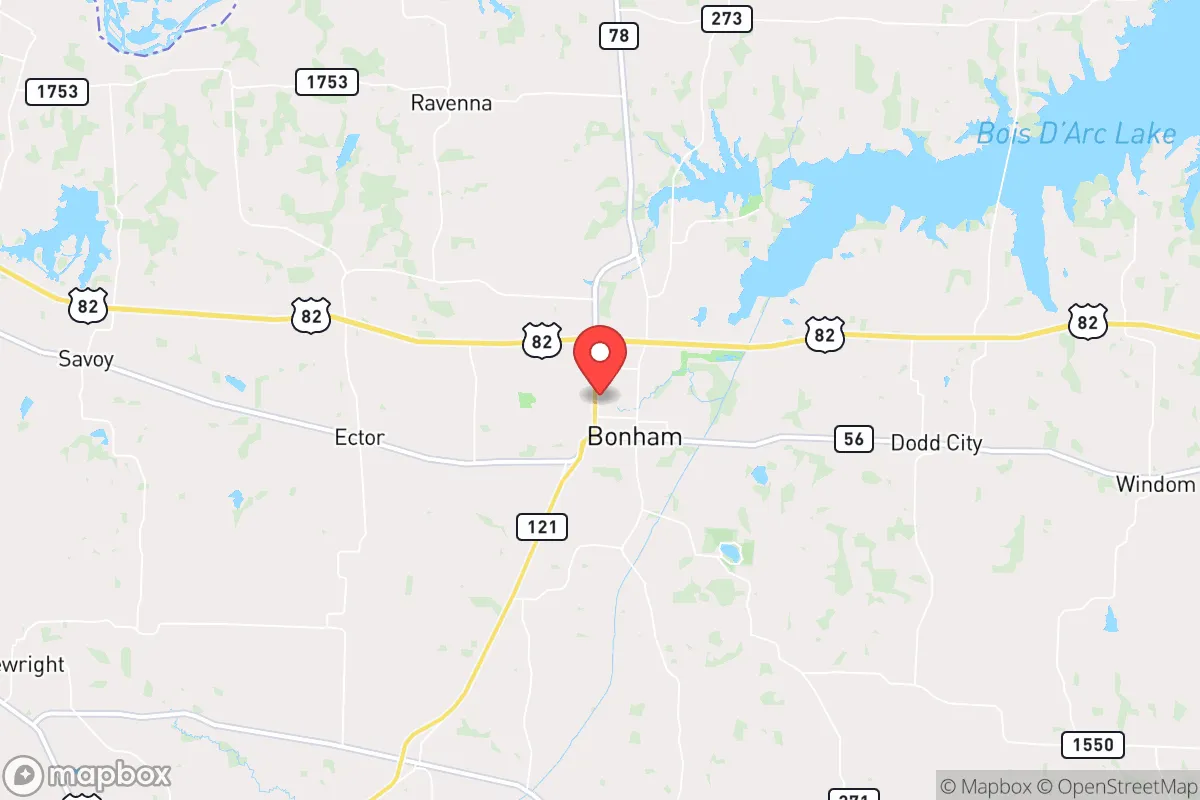
Demographics of Bonham, TX
Affluence Level in Bonham, TX
A low-income area with significant economic hardship. Household wealth and educational attainment are well below national averages.
People of Bonham, TX
The people of Bonham, Texas, today number 10,594, forming a community that is predominantly White (60.6%) with a significant Hispanic minority (21.5%) and a notable Black population (13.3%). The city retains a small-town, North Texas character, with a foreign-born share of just 5.7% and a college-educated rate of 15.8%—well below state averages. Bonham’s identity is rooted in its role as the Fannin County seat, a quiet agricultural and government hub where generational families mix with newer Hispanic arrivals, creating a population that is stable, conservative, and slowly diversifying.
How the city was settled and grew
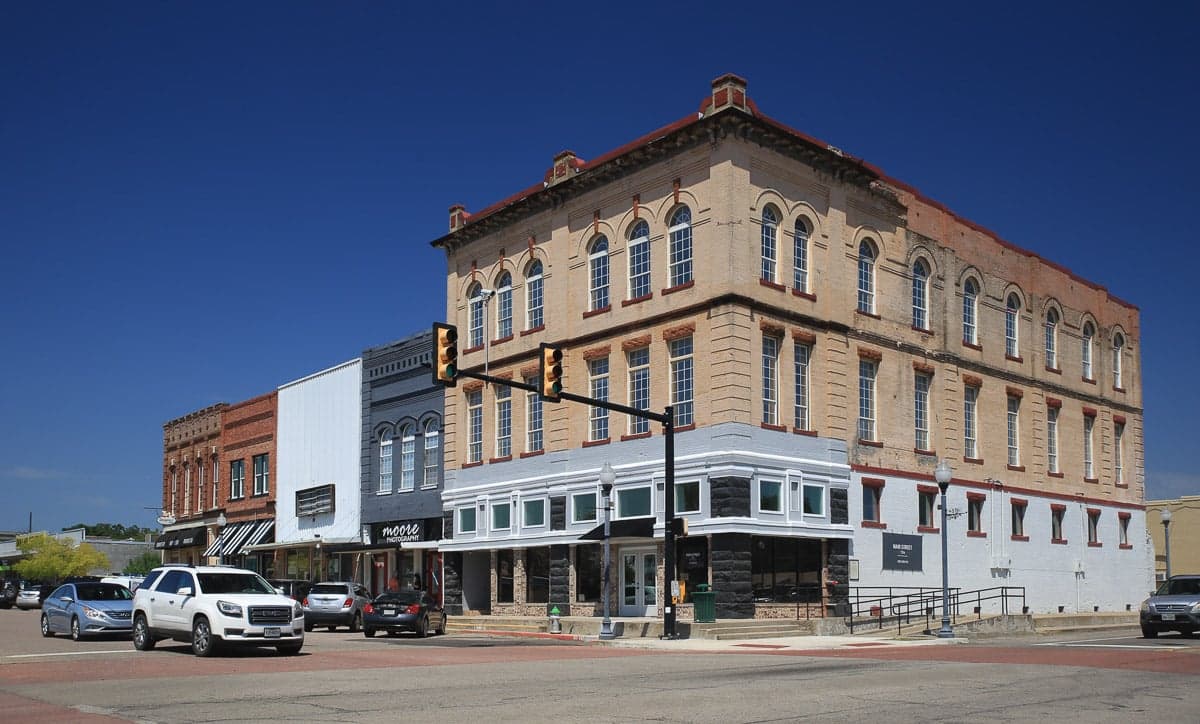
Bonham was founded in 1837 as Bois d’Arc, renamed in 1843 for James Bonham, a fallen Alamo defender. The original settlers were Anglo-American farmers and ranchers drawn by the Republic of Texas’s land grant system, which offered cheap acreage in the Red River Valley. These early families—many from Tennessee, Kentucky, and Arkansas—built the town around the county courthouse square, establishing Downtown Bonham as the commercial and civic core. By the 1870s, the arrival of the Missouri-Kansas-Texas Railroad spurred a second wave of Anglo settlers and a small number of freedmen who moved into the Southside neighborhood, historically the city’s Black community. Cotton and cattle drove the economy through the early 1900s, and the population remained overwhelmingly White and native-born, with a modest Black minority concentrated in Southside. The city’s growth was slow but steady, reaching roughly 5,000 residents by 1950, anchored by government jobs at the county courthouse and the nearby Sam Rayburn Reservoir project.
Modern era (post-1965)
The post-1965 period brought gradual demographic change. The Immigration and Nationality Act of 1965 had a muted direct effect on Bonham—unlike larger Texas cities—but its indirect impact arrived through domestic migration. Hispanic families, many of Mexican-American heritage from South Texas and the Rio Grande Valley, began moving to Bonham in the 1980s and 1990s for agricultural and light industrial work, settling primarily in the Westside area along Highway 56 and in the North Bonham neighborhood near the Fannin County Regional Medical Center. The Black population, which had been stable at around 15-18% since the 1940s, remained concentrated in Southside, though some families moved into the Eastside subdivision built in the 1970s. The White population, while still the majority, declined from roughly 75% in 1980 to 60.6% by 2020, as younger Anglo residents left for college and jobs in the Dallas-Fort Worth metroplex, 75 miles south. The Hispanic share grew from under 5% in 1980 to 21.5% today, making it the fastest-growing group. East/Southeast Asian residents (1.0%) and Indian-subcontinent residents (0.0%) remain negligible, reflecting Bonham’s limited draw for professional immigrants. The foreign-born share of 5.7% is almost entirely Hispanic, with a small number of Asian-origin families in the newer Lake Bonham Estates subdivision.
The future
Bonham’s population is heading toward greater Hispanic representation, though at a slower pace than in many Texas towns. The Hispanic share is projected to reach 25-28% by 2035, driven by higher birth rates and continued in-migration from South Texas and Mexico. The White population will likely continue its gradual decline, falling below 55% within two decades, while the Black share remains stable at 12-14%. The city is not tribalizing into distinct enclaves—neighborhoods like Westside and North Bonham are becoming more mixed, with younger Hispanic families moving into previously White areas. However, Southside remains predominantly Black, and the newer Lake Bonham Estates is overwhelmingly White and middle-class. The college-educated rate of 15.8% is unlikely to rise significantly without a major employer or university moving in, meaning Bonham will remain a blue-collar, family-oriented community. The foreign-born share may plateau near 7-8% as immigration from Mexico slows and second-generation Hispanic residents assimilate into English-dominant life.
Bonham is becoming a more Hispanic-influenced but still majority-Anglo small town, with a stable Black minority and virtually no Asian or Indian presence. For a conservative-leaning mover seeking a quiet, affordable county seat with strong community ties and low crime, Bonham offers a population that is aging in place but slowly diversifying—a place where change is incremental, not disruptive. New arrivals will find a town where generational families still dominate local politics and civic life, and where the biggest demographic story is the steady, organic growth of the Hispanic community into the fabric of the city.
* Values derived from national, state, county, city and local statistics and may differ in a specific area. Last updated: 2026-05-12T01:03:37.000Z
Narrative content on this page is AI-generated and may contain mistakes. Verify any details that matter before acting on them.
ReloMaps may earn a commission from affiliate links at no extra cost to you.