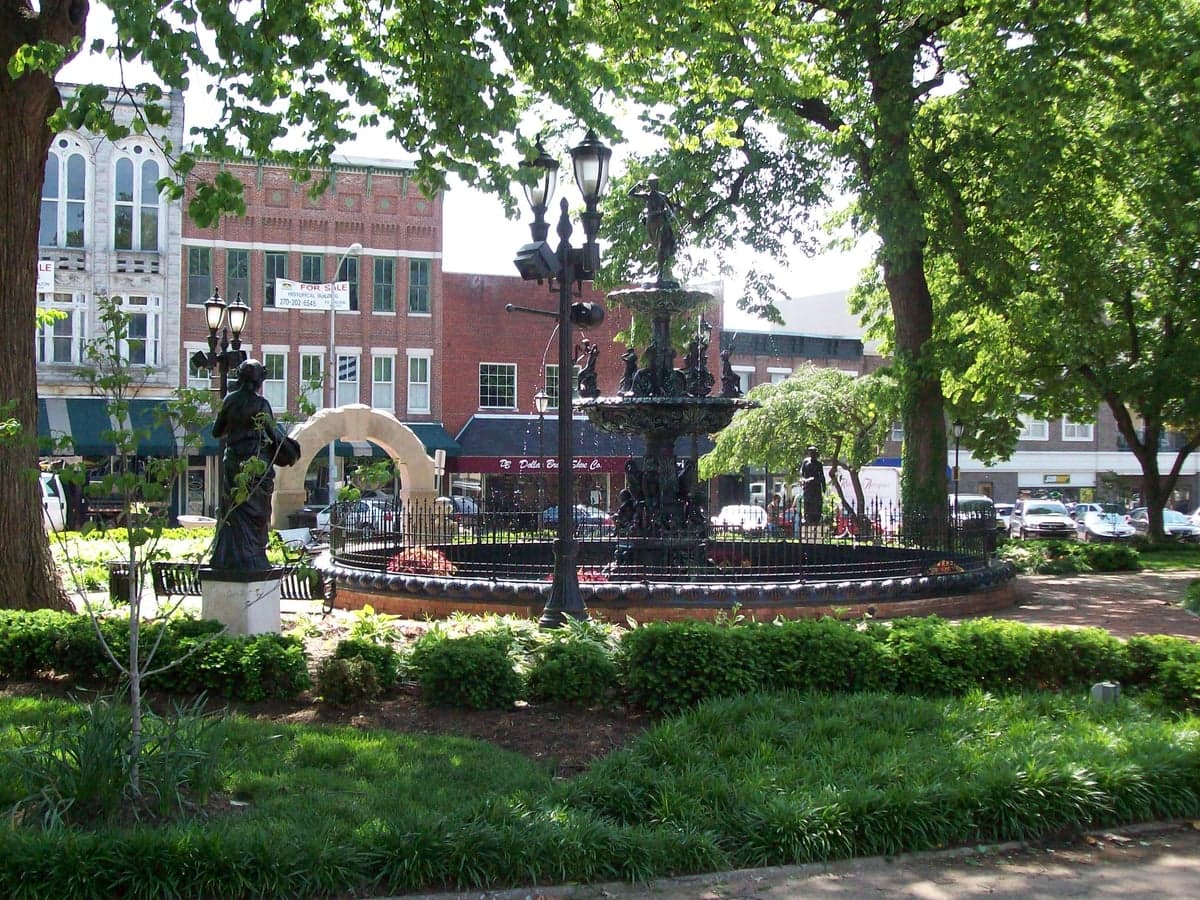
Photo: Wikipedia
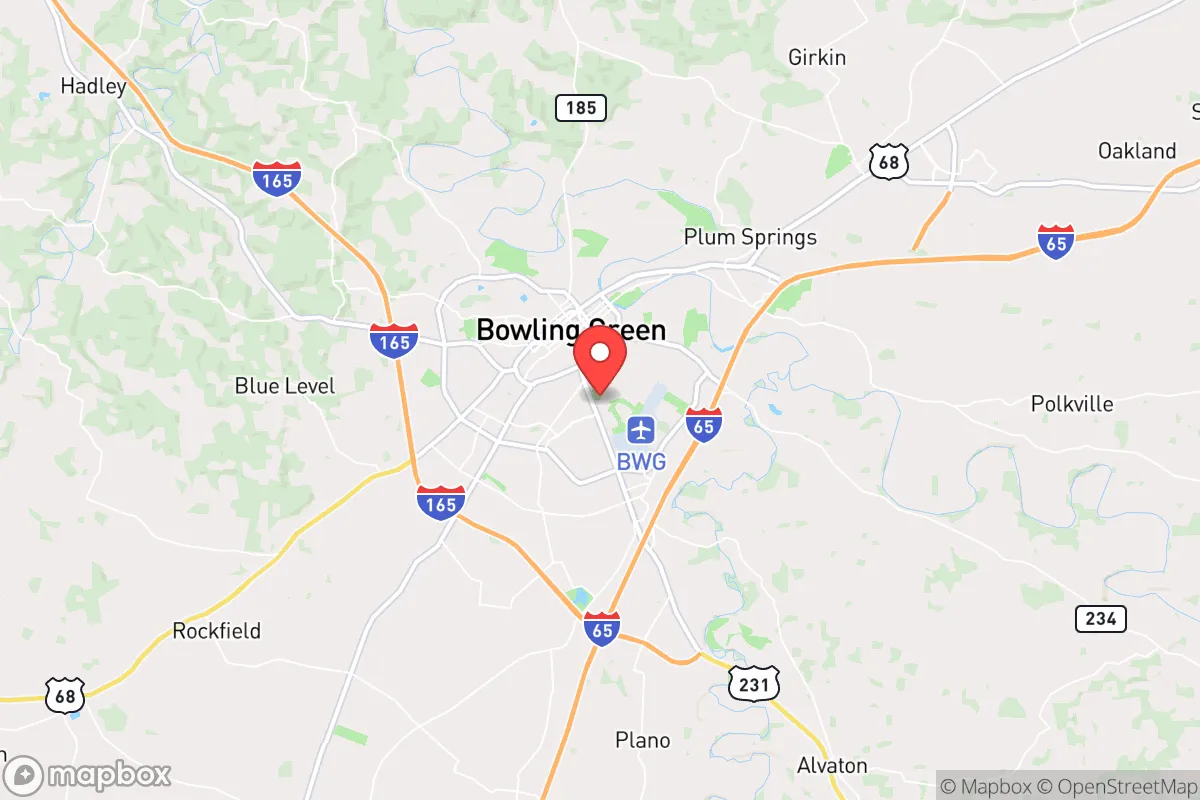
Quality of Life in Bowling Green, KY
A high quality of life with strong walkability, manageable living costs, healthy neighborhood signals, and solid amenity access.
What does Quality of Life tell us?
Quality of Life blends cost of living, nearby amenities, socioeconomic signals, and neighborhood character. City-level scores represent the whole municipality; individual neighborhoods can differ.
What does this tell us?
Quality of Life blends cost of living, nearby amenities, socioeconomic signals, and neighborhood character. City-level scores represent the whole municipality; individual neighborhoods can differ.
Cost of Living
18% below national average
The Real Cost of Living in Bowling Green, KY for 2026
| Tier | Individual | Family (4) |
|---|---|---|
| Survival | $15k | $28k |
| Comfortable | $45k | $66k |
| Luxury | $87k+ | $136k+ |
| Elite (Top 5%) | $119k+ | $185k+ |
73%
The Area Signal
A metric tracking the socioeconomic signals of the area.

Hobbies
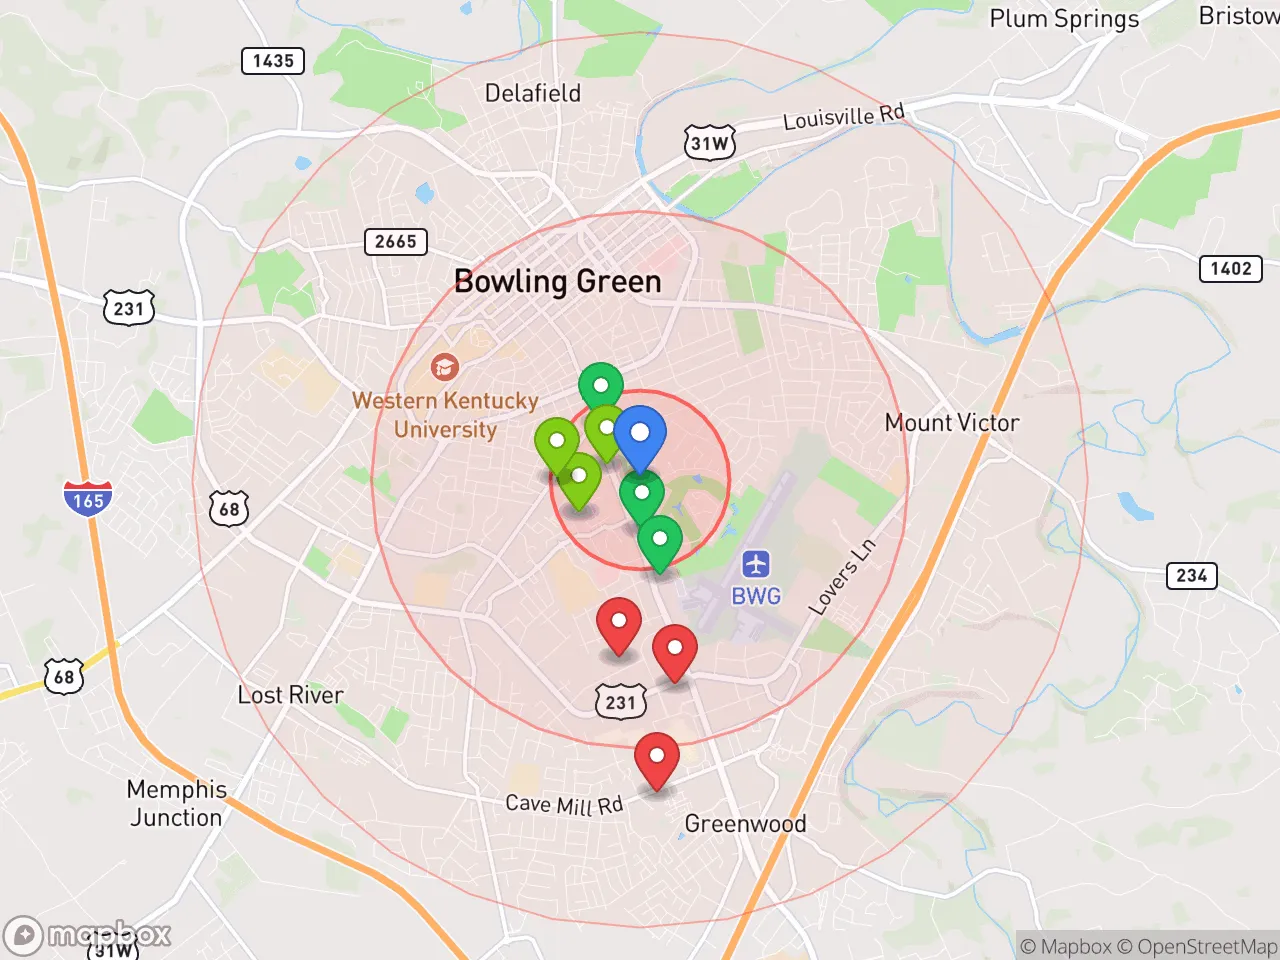
Explore the areaGroceries
7 within 10 miles
Gas
18 within 10 miles
Hospital
5 within 20 miles
Airport
BNA — Nashville International
Post Office
USPS — Bowling Green, KY
Critical Amenities
Quality-of-Life Analysis
Bowling Green, Kentucky, offers a quality of life defined by strong affordability and a steady, family-oriented pace, attracting a mix of young professionals from the region, automotive industry workers tied to the massive General Motors Corvette Assembly Plant, and students and faculty from Western Kentucky University (WKU). The city’s cost of living index sits at 82 (100 = U.S. average), making it significantly cheaper than the national norm while still providing access to urban amenities. This economic accessibility, combined with a median household income that outpaces the state average, creates a community where middle-class stability is the norm rather than the exception.
Cost of living, housing affordability, and how Bowling Green compares to nearby cities
Bowling Green’s housing market is the primary driver of its low cost of living. The median home value is $232,100, roughly $100,000 below the national median, while the median rent of $948 is nearly $300 less than the U.S. average. For context, a comparable home in Nashville, Tennessee—just 65 miles south—would cost roughly double, making Bowling Green a popular bedroom community for remote workers and commuters willing to trade a longer drive for a mortgage under $1,500. The average commute time of 18.8 minutes is notably short, well below the national average of 26 minutes, meaning residents spend less time in traffic and more time at home or at local parks. Property taxes in Warren County are also low, with an effective rate around 0.72%, further stretching household budgets. While home prices have risen about 30% since 2020, they remain among the most attainable in the I-65 corridor between Louisville and Nashville.
What daily life is like for families: schools, amenities, and local rhythm
Daily life in Bowling Green centers on a mix of college-town energy and suburban calm. The Bowling Green Independent School District and Warren County Public Schools both perform above the Kentucky state average on standardized tests, with the district’s Gifted & Talented program at Parker-Bennett-Curry Elementary drawing families from across the county. WKU’s presence brings cultural amenities like the Southern Kentucky Performing Arts Center (SKyPAC) and the annual International Festival, which are uncommon for a city of roughly 75,000. For outdoor recreation, the 1,200-acre Barren River Lake State Resort Park is a 20-minute drive, offering hiking, fishing, and camping. The city’s historic downtown square, anchored by the iconic Fountain Square Park, hosts a farmers market from April through October and a calendar of free concerts. Retail and dining are concentrated along Scottsville Road, with big-box stores and national chains, but a growing number of local breweries and farm-to-table restaurants are emerging near the WKU campus. The overall rhythm is slower than Nashville but faster than most rural Kentucky towns, with weekend traffic on I-65 being the primary congestion point.
Bowling Green is best suited for families, early-career professionals, and retirees seeking a low-stress, low-cost environment with solid schools and short commutes. The city’s economy is anchored by manufacturing (GM, Fruit of the Loom, and several logistics firms) and education, providing stable employment that matches the cost of living. Those who thrive here value predictability, community events, and outdoor access over nightlife or high-end urban amenities. For anyone priced out of Nashville or Louisville but unwilling to sacrifice a four-season climate and a walkable downtown, Bowling Green offers a pragmatic, high-value quality of life that consistently ranks among the most livable small metros in the South.
Crime in Bowling Green, KY
Generally safer than 61% of comparable U.S. locations.
Violent CrimeViolent Crime Analysis
Property CrimeProperty Crime Analysis
Crime Analysis
Bowling Green, Kentucky, presents a mixed safety profile that demands careful consideration from potential residents. The city's violent crime rate of 183.1 incidents per 100,000 residents is notably lower than both the Kentucky state average and the national median, offering a degree of reassurance. However, the property crime rate of 2,232.1 per 100,000 is significantly elevated, exceeding the national average by a considerable margin and representing the primary public safety concern for most households.
Crime in context
When placed against broader benchmarks, Bowling Green's violent crime rate is roughly half the national average, a statistic that places it among safer mid-sized cities in the South for serious offenses like homicide and aggravated assault. The property crime picture, however, is starkly different. The city's rate is approximately 30% higher than the national average, driven largely by theft and vehicle break-ins. This disparity between low violent crime and high property crime is a common pattern in college towns and regional economic hubs, where transient populations and higher density of unattended vehicles create more opportunities for non-violent offenses.
What residents experience
Daily life in Bowling Green for most residents involves standard urban precautions rather than pervasive fear. The elevated property crime rate translates to practical realities: locking vehicles and homes consistently, avoiding leaving valuables in plain sight, and being vigilant in parking lots near Western Kentucky University and the city's busy retail corridors along Scottsville Road. Violent crime is largely concentrated in specific areas and often involves individuals known to one another, meaning random attacks on strangers are rare. The Warren County Sheriff's Office and Bowling Green Police Department maintain visible patrols, and community policing initiatives have been active, though response times can vary in outlying neighborhoods.
Neighborhood-level variation
Safety conditions in Bowling Green vary substantially by neighborhood. Areas near the downtown core and some older residential districts east of I-65 report higher property crime incidents, while newer subdivisions in the northwest and southern edges of the city—such as those near the Greenwood Mall and along the William H. Natcher Parkway—tend to have lower crime rates. The presence of a large university population also creates seasonal fluctuations, with property crimes typically spiking during academic semesters. Prospective renters and homebuyers should examine block-level crime maps and consult with local real estate agents familiar with specific subdivisions, as a street-by-street difference of several blocks can mean a significant change in safety statistics.
* Values derived from national, state, county, city and local statistics and may differ in a specific area. Last updated: 2026-04-21T09:51:58.000Z
Narrative content on this page is AI-generated and may contain mistakes. Verify any details that matter before acting on them.
ReloMaps may earn a commission from affiliate links at no extra cost to you.