
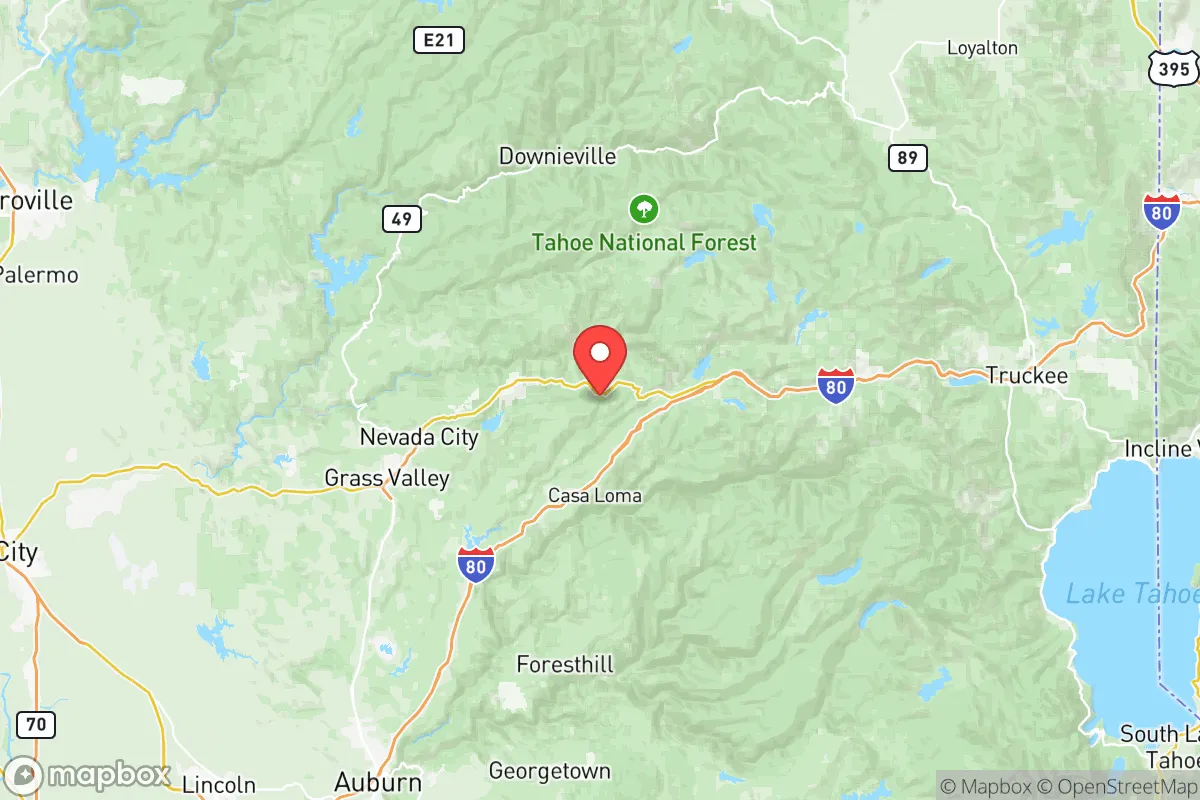
Photo: Wikipedia
Quality of Life in Nevada County
A livable area that tracks near national norms for affordability, walkability, and neighborhood health.
What does Quality of Life tell us?
Quality of Life measures an area by evaluating factors like cost of living, nearby amenities, country club access, airport proximity, socioeconomic signals and neighborhood character. For large states, this is a general average — quality of life can vary dramatically between metro areas, suburbs, and rural communities within the same state.
What does this tell us?
Quality of Life measures an area by evaluating factors like cost of living, nearby amenities, country club access, airport proximity, socioeconomic signals and neighborhood character. For large states, this is a general average — quality of life can vary dramatically between metro areas, suburbs, and rural communities within the same state.
Cost of Living
70% above national average
51%
The Real Cost of Living in Nevada County for 2026
| Tier | Individual | Family (4) |
|---|---|---|
| Survival | $26k | $49k |
| Comfortable | $113k | $166k |
| Luxury | $153k+ | $238k+ |
| Elite (Top 5%) | $194k+ | $301k+ |
Quality-of-Life Analysis
Nevada County, California, offers a spectrum of living environments that ranges from the historic, amenity-rich town of Nevada City to the more suburban Grass Valley and the deeply rural, forested communities of the San Juan Ridge and the Yuba River canyon. The county’s character is defined by its Gold Rush history, its position in the Sierra Nevada foothills, and a population that includes artists, remote workers, retirees, and outdoor enthusiasts. The choice of where to live within the county largely depends on whether a resident prioritizes walkable downtowns, quiet acreage, or proximity to the South Yuba River and Tahoe National Forest.
Largest town(s) & population centers
The two primary population centers are Grass Valley (pop. ~13,000) and Nevada City (pop. ~3,200), which together form the commercial and cultural hub of the county. Grass Valley is the larger, more practical town, with big-box retail along Idaho-Maryland Road, a historic downtown with restaurants and breweries, and the county’s main hospital (Sierra Nevada Memorial). Daily life here is car-dependent but convenient, with a median commute of just over 24 minutes — notably short for a foothill county. Nevada City, three miles north, is more compact and tourist-oriented, with a preserved 19th-century downtown, independent bookstores, and a strong arts scene centered on the Nevada Theatre and the Miners Foundry. Both towns have a cost of living index of 170 (70% above the national average), driven by median home values of $602,800 and median rents of $1,635. Residents in these towns typically have walkable access to cafes, grocery stores, and community events, but pay a premium for that convenience.
Smaller towns & rural pockets
Outside the Grass Valley–Nevada City corridor, the county opens into distinct rural communities. Penn Valley (southwest of Grass Valley) is a lower-elevation, more affordable area with a mix of ranchettes and manufactured homes, popular with families seeking larger lots. North San Juan and Rough and Ready are unincorporated communities on the San Juan Ridge, where residents live on forested acreage, often off-grid or with well and septic systems. The Lake Wildwood gated community near Penn Valley offers a private lake and golf course for those seeking a planned rural lifestyle. Washington, a tiny hamlet on the South Yuba River, is the most remote settlement, accessible via a winding road and popular with second-home owners and river guides. These areas lack the retail and medical infrastructure of the main towns; residents typically drive 15–30 minutes to Grass Valley for groceries or healthcare.
Cost & lifestyle range
The cost of living varies significantly across the county. At the high end, Nevada City’s historic district and the Lake of the Pines gated community (near Grass Valley) command home prices well above the county median, often exceeding $800,000 for a single-family home. At the lower end, Penn Valley and parts of Rough and Ready offer homes in the $350,000–$450,000 range, though these often require significant repairs or are on shared well systems. Rentals are scarce countywide, with the median rent of $1,635 often representing a studio or one-bedroom in the towns; rural rentals are even harder to find. The lifestyle trade-off is clear: town residents pay more for housing but gain walkability, events, and shorter commutes, while rural residents accept longer drives and fewer services in exchange for privacy, acreage, and lower property costs. The average commute of 24.4 minutes reflects the fact that many residents work locally or remotely, though some commute to Sacramento (about 60 minutes south) or Reno (about 75 minutes east).
Nevada County best suits those who value outdoor recreation — hiking, mountain biking, and river swimming — and who can tolerate a limited job market and a high housing cost relative to local wages. Remote workers, retirees, and self-employed creatives are common. Families should weigh the strong public schools in the Grass Valley and Nevada City districts against the limited after-school options in rural areas. For anyone seeking a balance of small-town culture and wilderness access, the county offers a clear gradient of choices, from the historic streets of Nevada City to the quiet ridgetops of the San Juan Ridge.

Crime in Nevada County
Higher crime rates than 58% of comparable U.S. locations.
Violent CrimeViolent Crime Analysis
Property CrimeProperty Crime Analysis
Crime Analysis
Nevada County, California, presents a mixed safety picture where crime rates consistently exceed national averages, though significant variation exists between its more rural communities and the county’s population centers. The county’s overall violent crime rate stands at 434.7 incidents per 100,000 residents, while property crime reaches 1,820.6 per 100,000, both figures notably higher than the national median. Residents in towns like Grass Valley and Nevada City experience the bulk of reported incidents, while more remote areas such as Penn Valley and the unincorporated communities near the Tahoe National Forest tend to report lower crime volumes.
Crime in context
When measured against California’s statewide averages, Nevada County’s violent crime rate is roughly on par with the state figure, but its property crime rate is elevated. The county’s property crime rate of 1,820.6 per 100,000 is approximately 15% higher than the California average and well above the national rate of roughly 1,950 per 100,000. Violent crime in Nevada County, at 434.7 per 100,000, is slightly below the state average of about 442 per 100,000 but still exceeds the national rate of approximately 380 per 100,000. These numbers place Nevada County in a moderate-risk category among California’s 58 counties, though the trend has been concerning: property crime has risen in recent years, particularly vehicle theft and burglary, which are concentrated in the more accessible towns along the Highway 49 corridor.
What residents experience
Daily life for Nevada County residents involves a heightened awareness of property crime, especially in Grass Valley and Nevada City, where downtown areas and residential neighborhoods near commercial corridors see regular thefts from vehicles and package thefts. The county’s progressive judicial leadership, including District Attorney Jesse Wilson, has pursued a reform-oriented approach that emphasizes diversion programs and reduced incarceration for non-violent offenders. While this policy aims to reduce recidivism, critics argue it has contributed to a revolving-door effect for property criminals, particularly those arrested in Grass Valley and then quickly released. Violent crime, while less common, is not negligible: aggravated assaults make up the majority of violent incidents, often linked to domestic disputes or alcohol-related altercations in the county’s bar-heavy downtowns. Residents in the more affluent, gated communities of Lake of the Pines and the rural outskirts of Penn Valley report far fewer incidents, though they remain vulnerable to occasional burglaries targeting unoccupied homes.
Neighborhood-level variation
Crime in Nevada County is not evenly distributed. The city of Grass Valley, with its denser population and older housing stock, accounts for a disproportionate share of both violent and property crime, with the area around the Grass Valley Shopping Center and the Brunswick Basin seeing the highest call volumes. Nevada City, the county seat, has a lower violent crime rate but struggles with theft from vehicles and shoplifting in its historic downtown. By contrast, the unincorporated community of Alta Sierra and the rural stretches near the Yuba River experience crime rates well below the county average, often 30-40% lower than Grass Valley’s. The county’s proximity to Sacramento and the I-80 corridor also means that transient property crime rings occasionally pass through, targeting vehicles in trailhead parking lots near the Tahoe National Forest. For prospective residents, the safest choices are the more remote, low-density areas, while those moving to Grass Valley or Nevada City should budget for security measures like cameras and alarm systems.
* Values derived from national, state, county, city and local statistics and may differ in a specific area. Last updated: 2026-09-28T15:44:59.000Z
Narrative content on this page is AI-generated and may contain mistakes. Verify any details that matter before acting on them.
ReloMaps may earn a commission from affiliate links at no extra cost to you.

