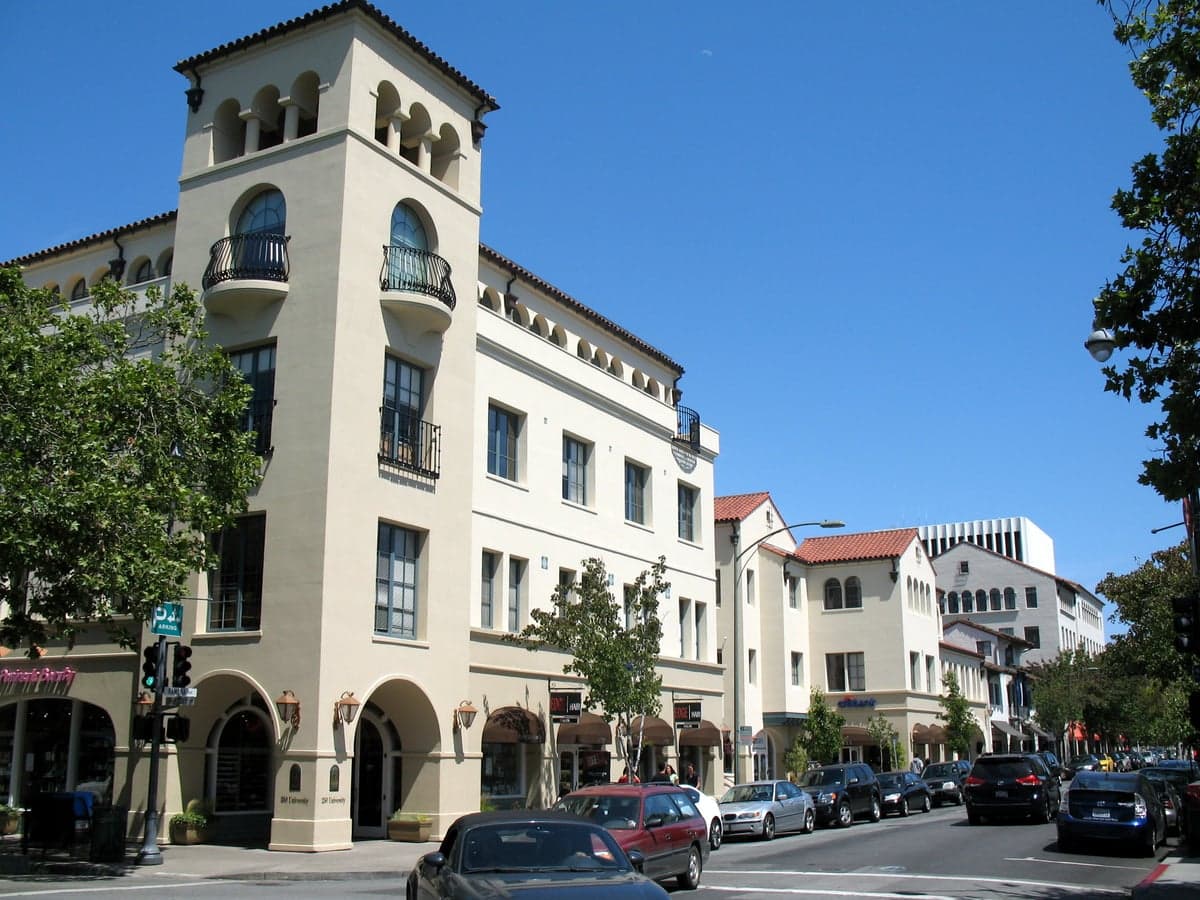
Photo: Wikipedia
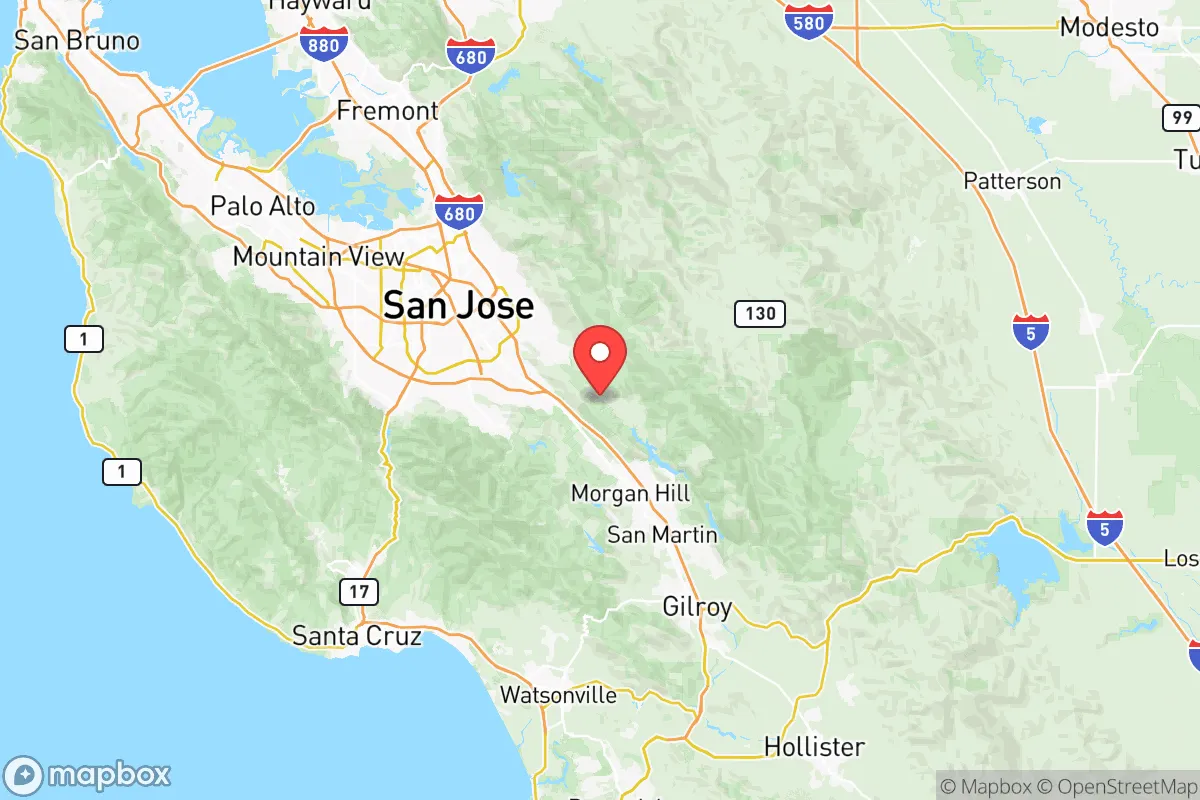
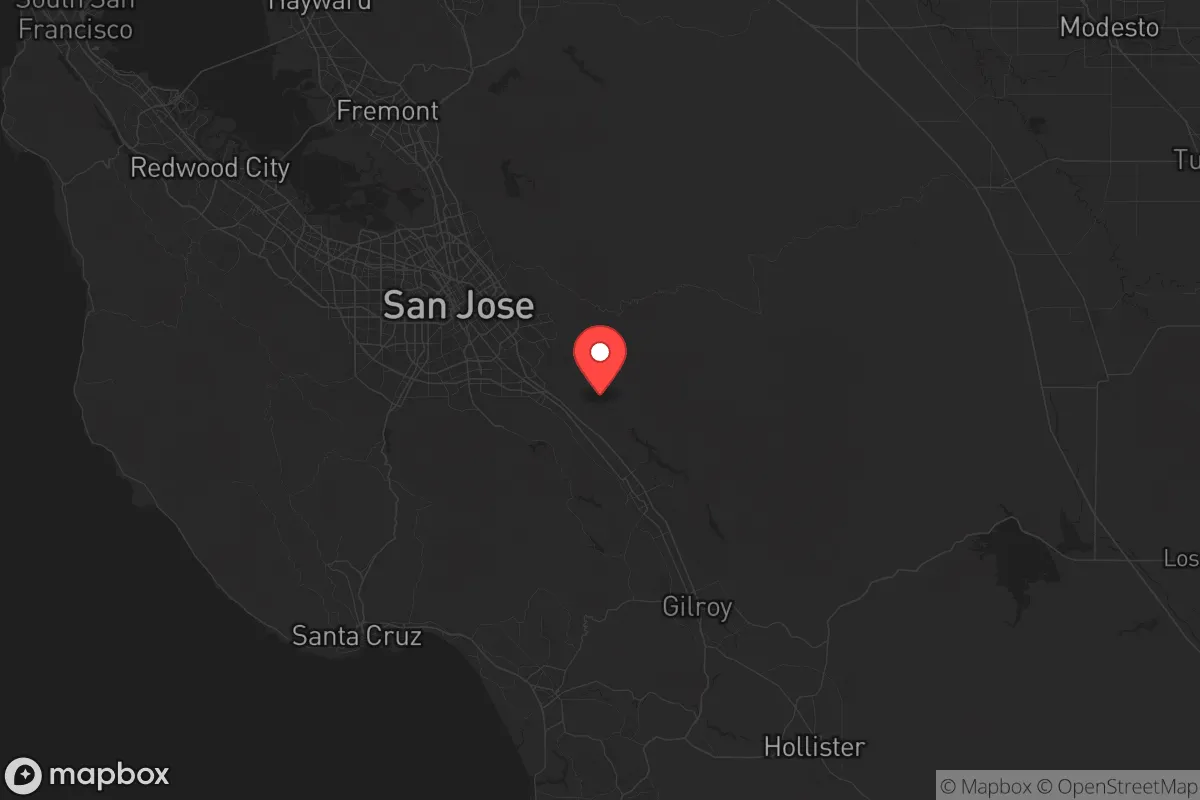
Demographics of Santa Clara County
Affluence Level in Santa Clara County
A wealthy area with high-earning, well-educated households. Incomes, home values, and educational attainment meaningfully outpace national averages.
People of Santa Clara County
Santa Clara County’s 1.9 million residents form one of the most ethnically complex and economically stratified populations in the United States. The county is 28.2% white, 25.1% Hispanic, 28.6% East and Southeast Asian, 10.7% Indian (subcontinent), and 2.3% Black, with 55.9% of adults holding a college degree. Its character is defined by the tension between a tech-driven, globally connected economy and a deeply layered human history of agricultural settlement, suburban expansion, and successive waves of immigration that have reshaped every corner from Palo Alto to Gilroy.
Settlement & growth (pre-1960)
Before European contact, the region was home to the Ohlone people, who lived in dozens of independent tribes along the creeks and bays of what is now Santa Clara County. Spanish colonization began in 1777 with the founding of San José as the first civilian settlement in California—originally a farming outpost called El Pueblo de San José de Guadalupe. The Spanish and later Mexican rancho system distributed vast land grants, and after the U.S. annexation in 1848, the Gold Rush brought a sudden influx of Anglo-American settlers, many of whom stayed to farm wheat and later fruit orchards.
The real agricultural boom came between 1870 and 1920, when the county became known as the “Valley of Heart’s Delight” for its apricot, prune, and cherry orchards. This period drew Italian immigrants, who settled heavily in San José’s Little Italy and Morgan Hill, working as orchardists and cannery laborers. Portuguese immigrants from the Azores arrived in the same decades, concentrating in San José’s Five Wounds neighborhood and Gilroy, where they established dairy farms and later joined the garlic-processing industry. Japanese immigrants, recruited for railroad and agricultural labor, formed tight-knit farming communities in San José’s Japantown—one of only three remaining in the U.S.—and in Sunnyvale and Cupertino, where they grew strawberries and flowers. The 1910s and 1920s also saw Mexican migration accelerate, as the Mexican Revolution and demand for farm labor drew families into San José’s East Side and Gilroy.
The Dust Bowl and Great Depression brought white migrants from Oklahoma, Arkansas, and Texas—often called “Okies”—who worked the canneries and orchards, settling in working-class neighborhoods in San José and Campbell. World War II transformed the region: the Japanese American community was forcibly interned, and after the war, many returned to find their land seized or sold. Meanwhile, the postwar boom and the rise of defense industries (Lockheed, IBM, Fairchild Semiconductor) began pulling in educated engineers from across the U.S., laying the groundwork for the tech economy. By 1960, Santa Clara County was still majority white and heavily agricultural, but the seeds of its transformation had been planted.
Modern era (post-1965)
The 1965 Hart-Cellar Immigration Act fundamentally rewired Santa Clara County’s demographics. The law eliminated national-origin quotas and prioritized family reunification and skilled labor, opening the door to massive immigration from Asia and Latin America. Simultaneously, the rise of Silicon Valley—anchored by Stanford University and companies like Hewlett-Packard, Intel, and Apple—created an insatiable demand for engineers and technicians, pulling in highly educated immigrants from East Asia, South Asia, and later the Indian subcontinent.
Chinese immigrants, many from Taiwan and Hong Kong, arrived in the 1970s and 1980s, settling in Cupertino, Saratoga, and San José’s West Valley. Vietnamese refugees, arriving after 1975, concentrated in San José’s East Side, which now hosts the largest Vietnamese American population of any city outside Vietnam. Korean immigrants built a commercial and residential hub in Santa Clara and San José’s North Valley. Filipino immigrants, many recruited as nurses and tech workers, settled across San José, Milpitas, and South San José. Indian immigrants—engineers, doctors, and entrepreneurs—began arriving in large numbers after 1990, clustering in San José’s Evergreen district, Milpitas, and Fremont (the latter in adjacent Alameda County but functionally part of the same metro). Today, the Indian subcontinent population stands at 10.7% of the county, a share that has doubled since 2000.
Hispanic population growth accelerated through both immigration and higher birth rates. Mexican and Central American immigrants, many working in construction, landscaping, and service industries, expanded the long-established barrios of San José’s East Side and Gilroy. The white population, which was over 80% in 1970, has fallen to 28.2% as of the latest data, driven by both out-migration (to lower-cost states) and the county’s diversification. The Black population, historically small at 2.3%, has remained stable but is concentrated in San José’s East Side and North San José, with roots in the Great Migration and postwar defense-industry recruitment.
Domestic migration has also reshaped the county. Since the 1990s, rising housing costs have pushed many middle-class white and Hispanic families to outlying counties like San Joaquin and Stanislaus, while high-income tech workers—both domestic and foreign-born—bid up prices in Palo Alto, Los Altos, and Cupertino. The result is a county that is simultaneously hyper-diverse and economically polarized: the foreign-born share is 19.3%, and the county’s median household income is among the highest in the nation, but the cost of living has made it one of the most unequal places in America.
The future
Santa Clara County’s population is likely to continue diversifying, but the character of that diversity is shifting. The East and Southeast Asian population (28.6%) and Indian subcontinent population (10.7%) are both still growing, driven by ongoing tech-sector recruitment from China, India, and Vietnam. However, the rate of growth has slowed as immigration policy has tightened and as some tech companies expand offices in lower-cost U.S. cities. The Hispanic population (25.1%) is projected to grow slowly, primarily through natural increase, as immigration from Mexico has plateaued. The white population is expected to continue its gradual decline, though it will remain a significant minority, concentrated in older, wealthier enclaves like Los Gatos and Saratoga.
The county is not homogenizing; rather, it is tribalizing into distinct ethnic and economic enclaves. Cupertino and Saratoga are heavily Chinese and Taiwanese; Milpitas and Evergreen are Indian-majority; East San José is predominantly Vietnamese and Hispanic; Gilroy and Morgan Hill remain largely Hispanic and white working-class. These enclaves are not ghettos—they are often affluent and well-integrated into the tech economy—but they are socially and culturally distinct, with separate grocery stores, religious institutions, and social networks. The next 10-20 years will likely see these enclaves deepen, as second-generation immigrants either assimilate into a pan-Asian or pan-Indian identity or move outward to suburbs in the Central Valley.
For someone moving in now, Santa Clara County offers a place where global diversity is the norm, but where that diversity is organized into distinct communities rather than a melting pot. The county’s identity is no longer agricultural or even broadly American—it is a patchwork of diasporas, each with its own trajectory, held together by the tech economy and the high cost of staying in it.
* Values derived from national, state, county, city and local statistics and may differ in a specific area. Last updated: 2026-05-15T23:37:34.000Z
Narrative content on this page is AI-generated and may contain mistakes. Verify any details that matter before acting on them.
ReloMaps may earn a commission from affiliate links at no extra cost to you.