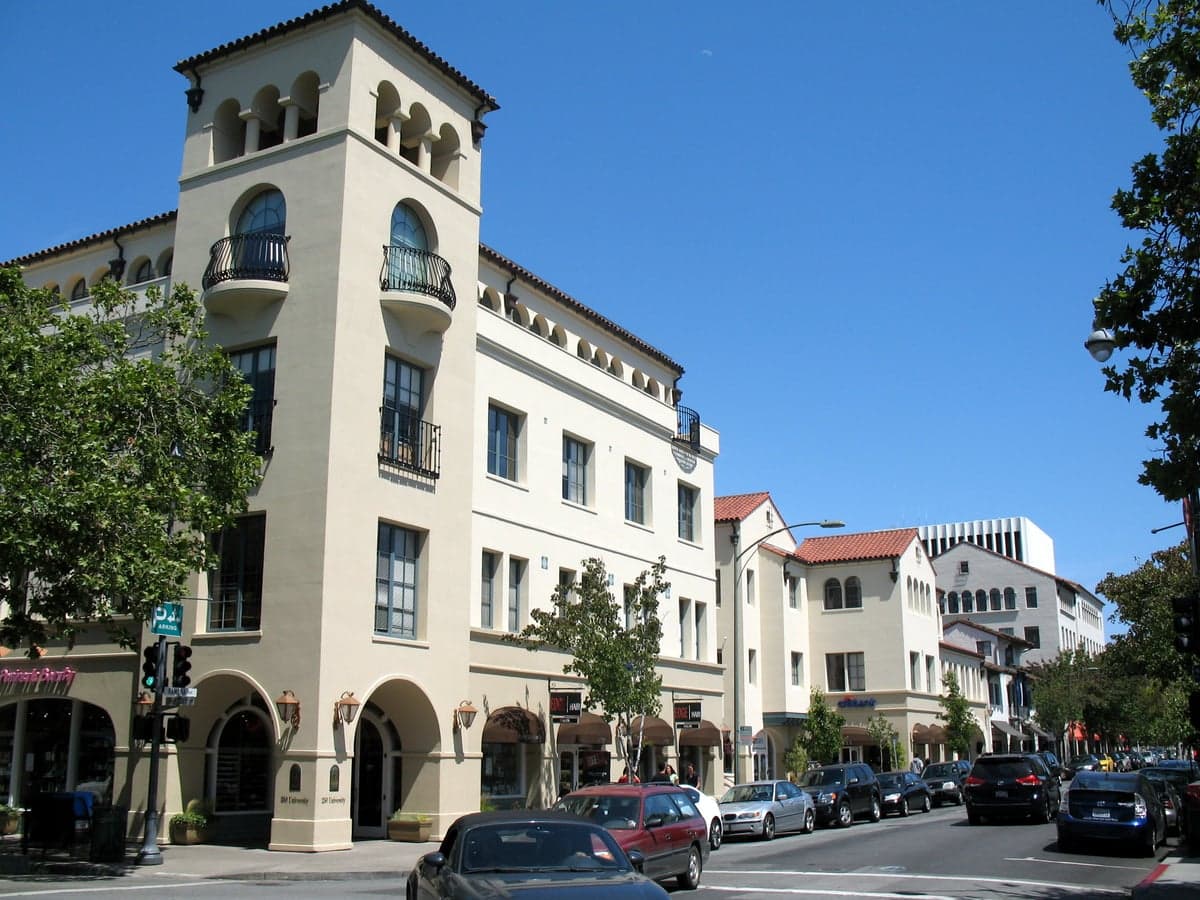
Photo: Wikipedia
Quality of Life in Santa Clara County
A livable area that tracks near national norms for affordability, walkability, and neighborhood health.
What does Quality of Life tell us?
Quality of Life measures an area by evaluating factors like cost of living, nearby amenities, country club access, airport proximity, socioeconomic signals and neighborhood character. For large states, this is a general average — quality of life can vary dramatically between metro areas, suburbs, and rural communities within the same state.
What does this tell us?
Quality of Life measures an area by evaluating factors like cost of living, nearby amenities, country club access, airport proximity, socioeconomic signals and neighborhood character. For large states, this is a general average — quality of life can vary dramatically between metro areas, suburbs, and rural communities within the same state.
Cost of Living
241% above national average
52%
The Real Cost of Living in Santa Clara County for 2026
| Tier | Individual | Family (4) |
|---|---|---|
| Survival | $45k | $84k |
| Comfortable | $208k | $306k |
| Luxury | $288k+ | $447k+ |
| Elite (Top 5%) | $359k+ | $557k+ |
Quality-of-Life Analysis
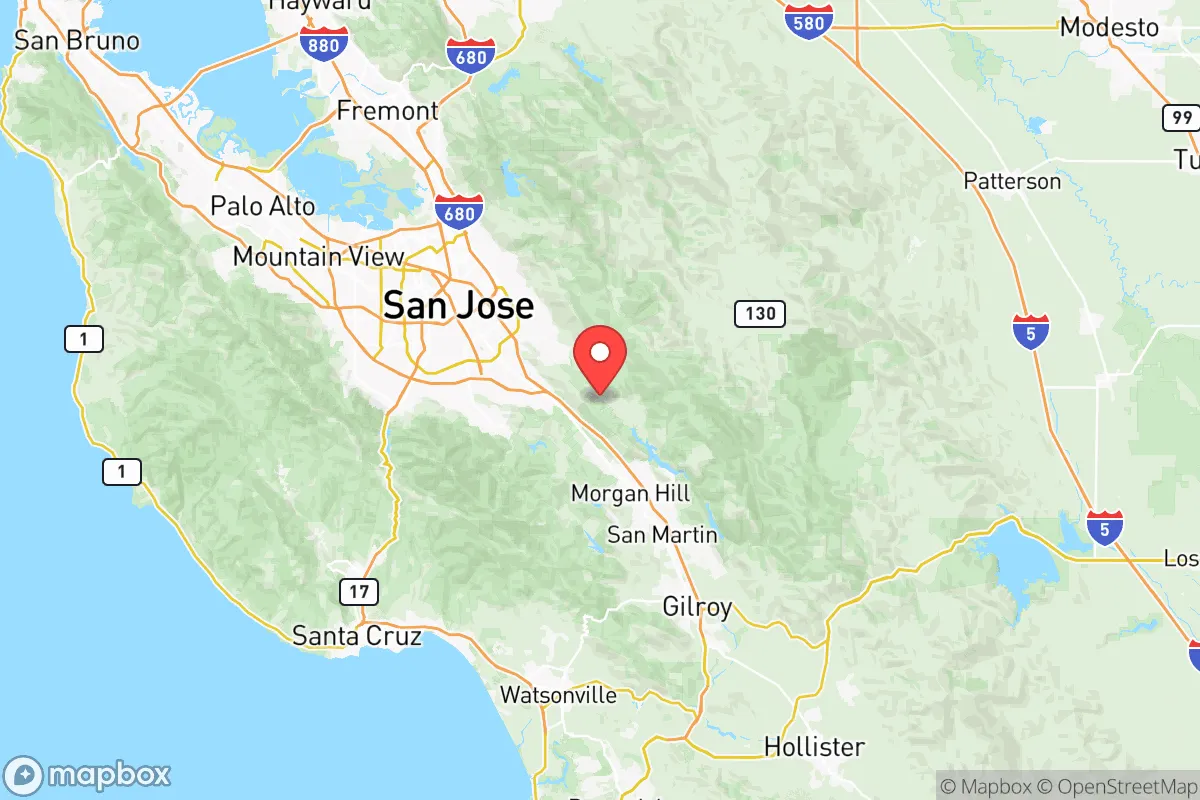
Santa Clara County offers one of the most dramatic quality-of-life spectrums in California, ranging from the dense, globally connected tech hub of San Jose to the agricultural quiet of Gilroy and the redwood-shaded rural pockets of the Santa Cruz Mountains. The county draws everyone from six-figure tech executives in Palo Alto and Cupertino to farmworkers and commuters seeking relative affordability in Morgan Hill, creating a region where lifestyle options shift sharply within a 30-minute drive.
Largest town(s) & population centers
San Jose, the county seat and third-largest city in California, anchors the urban core with a population exceeding 1 million. Daily life here is defined by sprawling suburban neighborhoods, a downtown that has grown significantly with tech offices and high-rise apartments, and a commute that averages 27 minutes—shorter than many Bay Area peers due to the city’s central location and extensive highway network (US 101, I-280, I-880). Sunnyvale, Mountain View, and Palo Alto form the heart of Silicon Valley along the US 101 corridor, where residents walk to Caltrain stations, bike to Google or Apple campuses, and pay a median rent of $2,814 for a one-bedroom. These cities offer dense walkable downtowns (Castro Street in Mountain View, University Avenue in Palo Alto) but also some of the highest home values in the nation, with the county median hitting $1,382,800. Cupertino and Santa Clara are more residential, with large tech campuses (Apple Park, Intel) and strong public schools that drive family demand.
Smaller towns & rural pockets
South of San Jose, Morgan Hill (pop. ~45,000) and Gilroy (pop. ~55,000) offer a slower pace with larger lots, horse properties, and a more agricultural feel. Gilroy, known as the "Garlic Capital of the World," retains working farms and a downtown with independent shops, attracting families priced out of the north county. Further into the Santa Cruz Mountains, unincorporated communities like Los Gatos Mountains, Summit Road, and Loma Mar provide redwood-forest living with no streetlights, well water, and winding roads—a 30-minute commute to San Jose but a world away in lifestyle. San Martin, an unincorporated area south of Morgan Hill, is a mix of nurseries, equestrian properties, and mobile home parks, offering some of the county’s lowest home prices (often under $800,000 for a fixer-upper). On the west side, Portola Valley and Woodside are wealthy, semi-rural enclaves with large estates and horse trails, while Alviso, a small neighborhood within San Jose, retains a marshy, working-class character with older homes and a distinct small-town feel.
Cost & lifestyle range
The county’s cost of living index of 341 (more than triple the US average) masks extreme internal variation. At the high end, Palo Alto and Los Altos Hills see median home prices above $3 million, with top-tier schools (Palo Alto Unified, Los Altos High) and proximity to Stanford University and venture capital firms. At the lower end, Gilroy and San Martin offer median home values around $800,000–$900,000, still expensive nationally but half the county average. Renters face similar spreads: a one-bedroom in downtown Palo Alto averages $3,200+, while the same unit in Gilroy or east San Jose can be found for $2,000–$2,400. Amenities vary accordingly: north county residents have walkable downtowns, farmers’ markets, and Caltrain access; south county residents rely more on cars and have fewer dining and entertainment options but gain space, quiet, and lower crime rates. The rural mountain areas lack public transit and require septic systems and fire-hardening, but offer privacy and nature access unmatched elsewhere in the region.
Santa Clara County best suits those who can leverage its economic opportunities while accepting its high costs. Tech workers and professionals who value short commutes and urban amenities thrive in the north county corridor. Families seeking more space and lower home prices gravitate to Morgan Hill and Gilroy. Rural enthusiasts who don’t mind a winding commute find solitude in the Santa Cruz Mountains or the Diablo Range foothills. The county’s diversity of lifestyle options—from dense transit-oriented cities to agricultural towns to mountain hideaways—means that with the right budget and priorities, a resident can find a version of Silicon Valley that fits their life, even if the overall cost of entry remains among the highest in the nation.
Crime in Santa Clara County
WARNING: The crime statistics are unreliable for this jurisdiction. Local authorities have either not reported or under reported their data to the FBI. This could be due to bad intentions, incompetence or technical issues. Regardless, we suggest skepticism.
Higher crime rates than 72% of comparable U.S. locations.
Violent CrimeViolent Crime Analysis
Property CrimeProperty Crime Analysis
Crime Analysis
Santa Clara County’s overall safety picture is a study in contrasts: its violent crime rate of 434 incidents per 100,000 residents sits notably above the national average of roughly 380, while its property crime rate of 1,816.3 per 100,000 is also elevated compared to the U.S. median of about 1,954. These countywide figures, however, mask sharp differences between individual cities and neighborhoods, driven in part by local policing strategies and the progressive policies of the District Attorney’s office, which have drawn criticism for prioritizing offender rehabilitation over public safety.
Crime in context
Santa Clara County’s violent crime rate is 14% higher than the national average and significantly above the California state rate of roughly 442 per 100,000. Property crime, while slightly below the national average, remains a persistent concern, particularly in urban centers. The county’s largest city, San José, reports a violent crime rate of approximately 450 per 100,000, driven by gang-related activity and property theft rings. In contrast, smaller cities like Cupertino and Los Altos enjoy violent crime rates below 150 per 100,000, thanks to affluent demographics and robust private security. The progressive policies of the Santa Clara County District Attorney’s office, which emphasize diversion programs and reduced sentencing for non-violent offenders, have been linked to a rise in repeat property crimes, as critics argue that leniency emboldens criminals and undermines deterrence.
What residents experience
For residents, the most tangible safety concern is property crime. Auto burglaries and catalytic converter thefts are epidemic in commercial corridors like San José’s Santana Row and downtown Palo Alto, where thieves target high-value vehicles. Residential burglaries are concentrated in neighborhoods near major highways (US-101 and I-280), providing quick escape routes. Violent crime, while less common, spikes in specific areas: East San José and Gilroy report higher rates of aggravated assault and robbery, often tied to gang disputes. The county’s homeless encampments, particularly along the Guadalupe River Trail and in Sunnyvale, have become hotspots for drug-related violence and theft. Residents in these areas frequently report feeling unsafe walking alone after dark, a sentiment amplified by the perception that the justice system is soft on repeat offenders.
Neighborhood-level variation
Safety varies dramatically by neighborhood. The safest enclaves are in the western foothills: Los Gatos and Saratoga report violent crime rates below 100 per 100,000, with property crime rates roughly half the county average. These communities benefit from well-funded police departments and active neighborhood watch programs. Conversely, downtown San José and parts of East San José experience violent crime rates exceeding 600 per 100,000, driven by poverty, gang activity, and a lack of police presence in high-density housing. The progressive policies of the District Attorney’s office, which has declined to prosecute certain low-level offenses and pushed for early release of inmates, have been blamed for emboldening criminals in these areas. For prospective residents, the safest bet is to focus on the western suburbs, while those considering central or eastern neighborhoods should research block-level crime maps and consider the impact of local judicial leniency on long-term safety.
* Values derived from national, state, county, city and local statistics and may differ in a specific area. Last updated: 2026-05-15T23:37:34.000Z
Narrative content on this page is AI-generated and may contain mistakes. Verify any details that matter before acting on them.
ReloMaps may earn a commission from affiliate links at no extra cost to you.