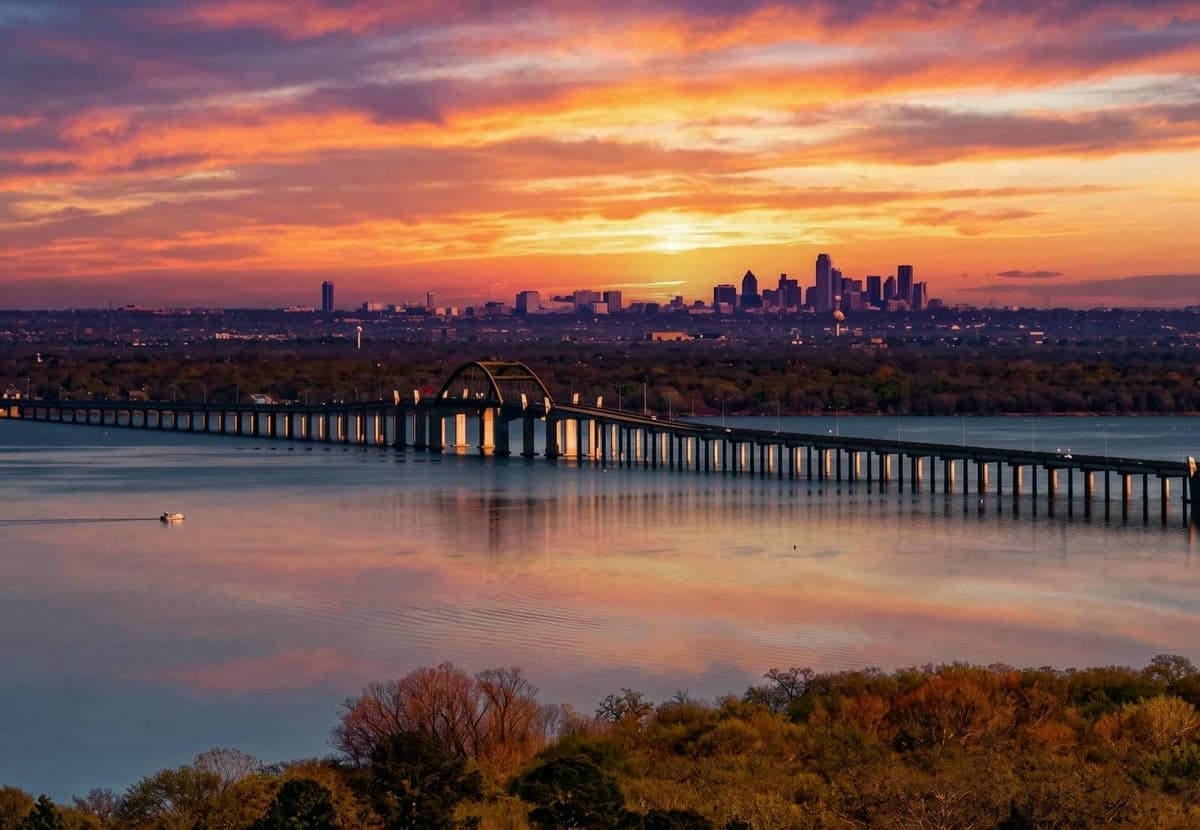
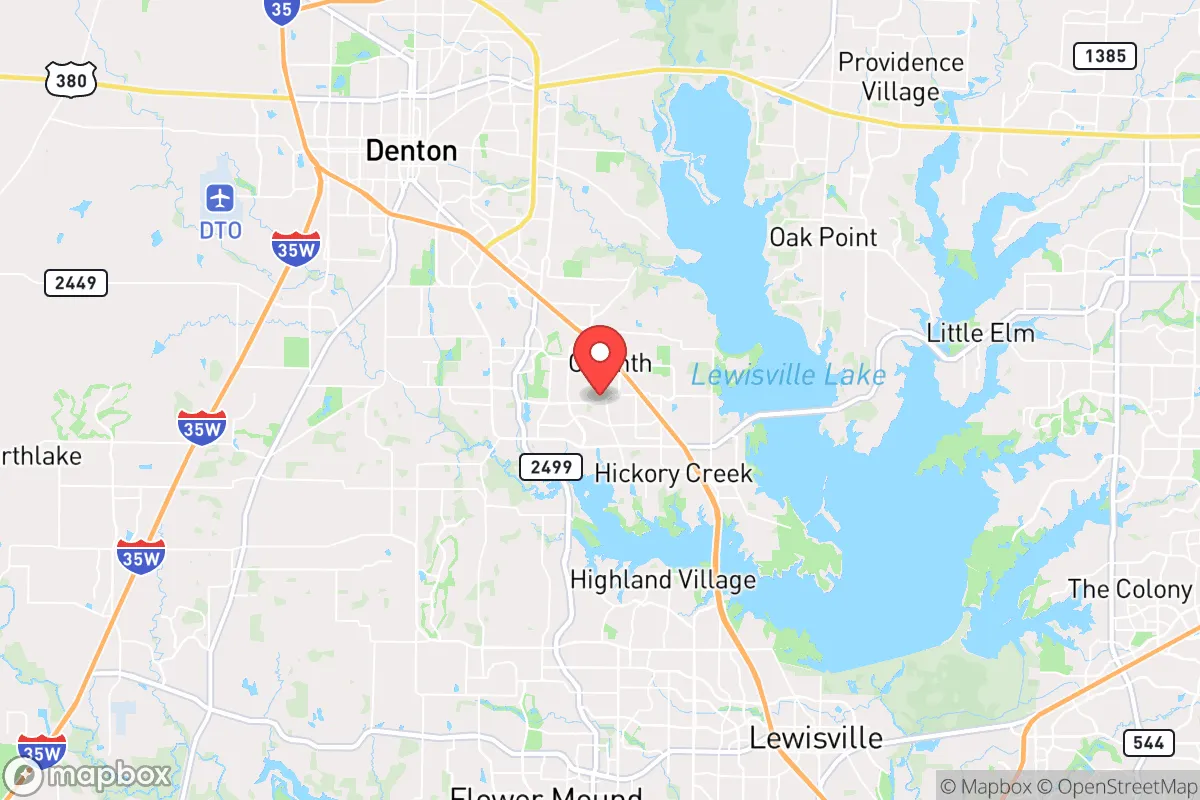
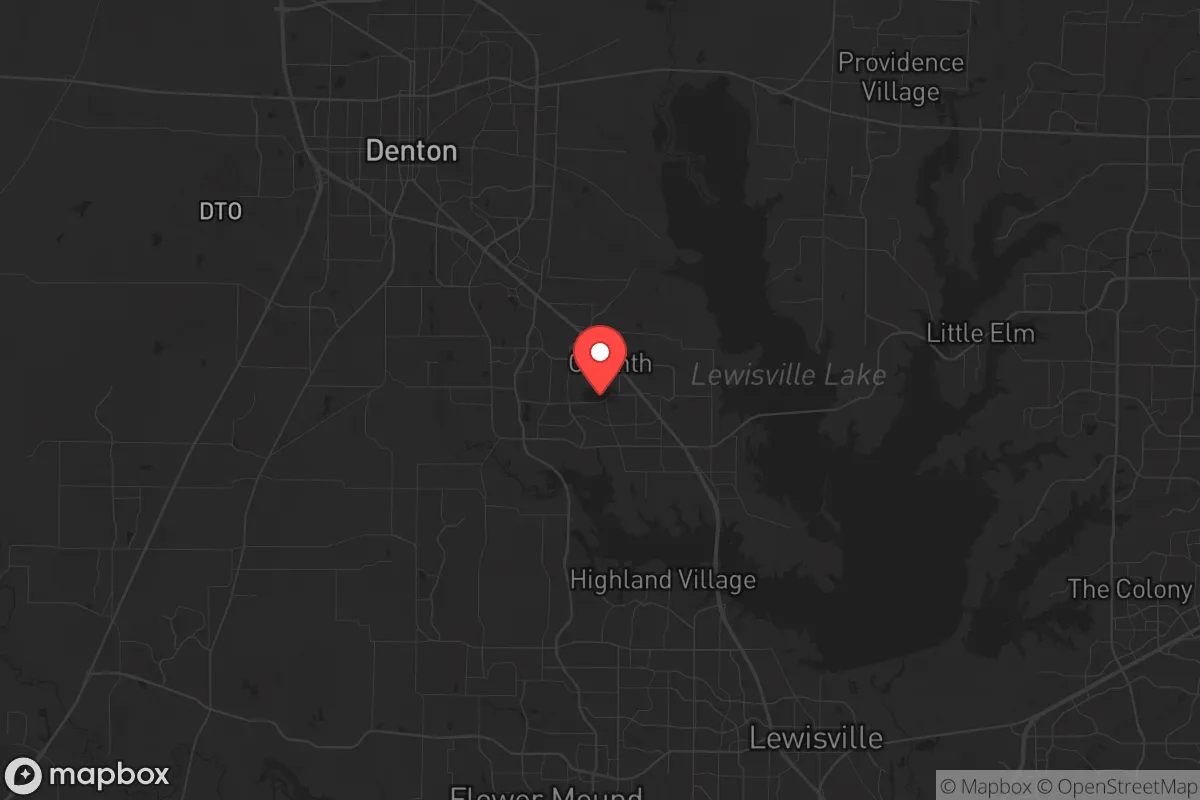
Demographics of Corinth, TX
Affluence Level in Corinth, TX
An upper-middle-class area. Household wealth, education levels, and homeownership run ahead of national benchmarks.
People of Corinth, TX
The people of Corinth, Texas today form a predominantly white, college-educated, and family-oriented community of 22,868 residents, with a notably low foreign-born share of 3.9% that marks it as a largely native-born suburb. The city’s character is defined by its quiet, master-planned subdivisions and a demographic profile that leans conservative, with a median household income well above the national average. Distinctive identity markers include a high proportion of married couples with children, a strong presence of veterans, and a population that is 67.5% white, 15.6% Hispanic, 7.9% Black, 3.0% East/Southeast Asian, and 1.4% Indian (subcontinent). Corinth is not a diverse melting pot but rather a collection of relatively homogeneous neighborhoods where different waves of settlement have left their mark.
How the city was settled and grew
Corinth is a post-1900 Sun Belt suburb, not a historic settlement with colonial roots. The area was originally part of the Peters Colony land grant in the 1840s, which drew Anglo-American farmers from the Upper South to the fertile Blackland Prairie. These early settlers, primarily of English and Scots-Irish descent, established scattered farmsteads and small crossroads communities. The name "Corinth" was adopted in the 1880s for a local church, but the area remained sparsely populated rural land through the early 20th century. The first significant population wave came after World War II, when returning veterans and their families sought affordable land north of Denton. These early suburbanites built modest homes on large lots in what is now the Lake Sharon Estates neighborhood, a area that still retains a semi-rural feel with older ranch-style houses and mature trees. A second wave of growth in the 1960s and 1970s brought middle-class white families from Dallas and Fort Worth, who settled in the Corinth Village subdivision, a grid of brick-and-frame homes that remains the city’s most established residential core.
Modern era (post-1965)
The post-1965 era, following the Hart-Celler Immigration Act, had a muted effect on Corinth compared to larger Texas cities. The city’s foreign-born population today is just 3.9%, far below the national average, indicating that international immigration has not been a major driver of growth. Instead, domestic in-migration from other parts of Texas and the U.S. fueled Corinth’s expansion. The 1980s and 1990s saw a surge of white-collar professionals moving north from Dallas, drawn by new master-planned communities and the expansion of the Dallas North Tollway. These newcomers filled neighborhoods like Highland Village (a gated community with larger homes and golf course access) and Shady Shores (a lake-adjacent enclave popular with families seeking water access). The Hispanic population, now 15.6%, began growing in the 1990s, primarily through domestic migration from South Texas and Mexico, and concentrated in the Lakewood Village area, where more affordable housing stock attracted working-class families. The Black population, at 7.9%, is largely composed of middle-class professionals who moved from Dallas in the 2000s, settling in newer subdivisions like Corinth Crossing. The East/Southeast Asian community (3.0%) is a more recent arrival, with many families drawn by the highly rated Lake Dallas Independent School District and settling in the Oakmont neighborhood. The Indian-subcontinent population (1.4%) is similarly small and concentrated among tech professionals working in the Dallas-Fort Worth metroplex.
The future
Corinth’s population is heading toward modest diversification, but the pace is slow. The white share has declined from roughly 75% in 2010 to 67.5% today, while the Hispanic share has grown from about 10% to 15.6% over the same period. The Black and Asian shares have also increased incrementally. However, the city is not tribalizing into distinct ethnic enclaves; rather, it is homogenizing into a broad middle-class suburb where income, not ethnicity, is the primary sorting mechanism. Newer subdivisions like Preserve at Corinth are attracting a mix of white, Hispanic, and Asian families, all drawn by the same school ratings and commute times. The immigrant communities are small enough that assimilation is the norm—there is no established ethnic enclave with its own commercial district or cultural institutions. The foreign-born share is likely to remain below 5% for the next decade, as high housing costs and limited rental inventory discourage new immigrant arrivals. The next 10-20 years will likely see Corinth continue its trajectory as a stable, predominantly white, college-educated suburb, with gradual growth in Hispanic and Asian populations but no dramatic demographic shift.
For someone moving in now, Corinth is becoming a place where demographic change is real but slow, and where the dominant culture remains conservative, family-oriented, and native-born. The city offers a safe, well-regarded school system and a low-crime environment, but it is not a hub of ethnic diversity or immigrant-driven dynamism. New residents should expect a community that values stability and homogeneity, with gradual diversification occurring primarily through domestic migration rather than international arrivals.
* Values derived from national, state, county, city and local statistics and may differ in a specific area. Last updated: 2026-05-16T22:45:52.000Z
Narrative content on this page is AI-generated and may contain mistakes. Verify any details that matter before acting on them.
ReloMaps may earn a commission from affiliate links at no extra cost to you.