Photo: Wikipedia
Demographics of Easton, MD
Affluence Level in Easton, MD
A middle-class area roughly in line with national averages across income, home values, education, and employment.
People of Easton, MD
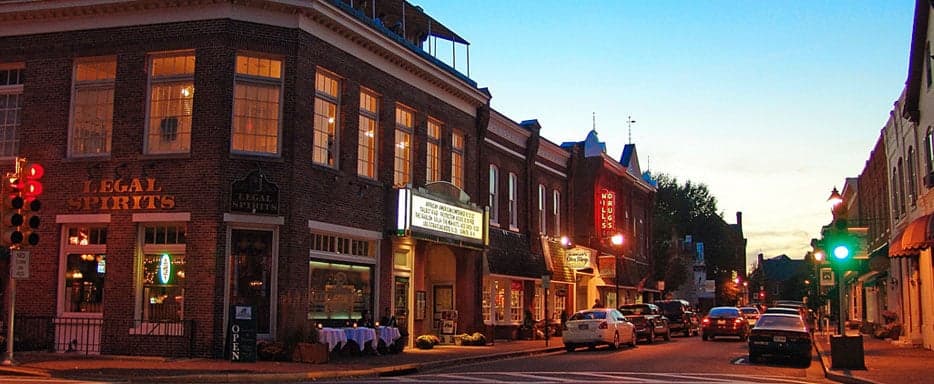
Easton, Maryland, is a historic Eastern Shore town of 17,202 residents that retains a distinctly small-town, family-oriented character while experiencing gradual diversification. The population is 67.5% White, 14.4% Black, 12.2% Hispanic, and 1.2% Indian (subcontinent), with 7.1% foreign-born overall and a well-educated base of 39.4% holding college degrees. Unlike many Maryland suburbs, Easton has not seen explosive growth but rather steady, managed change, with its identity still rooted in a blend of old Chesapeake families, a long-established Black community, and newer Latino and Indian arrivals. The city feels more like a stable county seat than a transient bedroom community, with a pace of life that appeals to families and professionals seeking a quieter, more predictable environment.
How the city was settled and grew
Easton was founded in 1710 as the Talbot County seat, drawing its earliest English settlers as tobacco planters and merchants who built the waterfront along the Tred Avon River. The historic West End neighborhood, with its 18th- and 19th-century homes, was the original residential core for these planter and merchant families. By the mid-19th century, enslaved and free Black laborers formed a substantial part of the population, and after the Civil War, a free Black community coalesced in the South Side neighborhood, centered around the Asbury United Methodist Church and the Hill Community. The arrival of the railroad in the 1860s brought a wave of German and Irish immigrants who settled in the Dutchmans Lane area, working as railroad laborers and in the canneries that processed the region's seafood and produce. Through the early 20th century, Easton remained a predominantly White and Black town, with the Black population concentrated in South Side and the White population spread across West End and the newer North Easton subdivisions built after World War II.
Modern era (post-1965)
The 1965 Hart-Cellar Act and subsequent immigration reforms had a modest but noticeable effect on Easton. The most significant post-1965 change has been the growth of the Hispanic population, which reached 12.2% by the 2020s. This wave began in the 1990s, driven by agricultural and construction labor demand on the Eastern Shore. Mexican and Central American families initially settled in the Easton Village apartment complexes and along the Port Street corridor, areas that offered affordable rental housing and proximity to farm and landscaping jobs. Today, Hispanic residents are more dispersed but remain concentrated in the eastern and southern parts of town. The Indian (subcontinent) population, now 1.2%, is a more recent arrival, largely composed of professionals in healthcare and information technology who began moving to Easton after 2010. They tend to settle in the newer subdivisions of Wye Mills and Chapel Woods, drawn by good schools and newer housing stock. The Black population, which was roughly 30% in 1970, has declined to 14.4% as many middle-class Black families moved to larger cities or to the more affordable outskirts of town, while the White population has held steady at around two-thirds. The East/Southeast Asian community remains very small at 0.7%, mostly families connected to the University of Maryland Shore Regional Health system.
The future
Easton's population is trending toward a more diverse but still majority-White composition over the next 10–20 years. The Hispanic share is likely to continue growing slowly, driven by family reunification and steady demand for service and agricultural labor, but Easton lacks the large immigrant enclaves seen in Salisbury or Baltimore, so assimilation into the broader community is the more likely path. The Indian professional population will probably grow modestly as the regional healthcare sector expands, but it will remain a small, highly educated niche. The Black population is expected to stabilize or decline slightly, as younger Black residents continue to leave for metro areas with more economic opportunities. The city is not tribalizing into distinct, isolated enclaves; rather, it is experiencing a gentle blending, with most neighborhoods becoming incrementally more mixed. The biggest demographic wildcard is whether Easton can attract and retain younger families of any background, as the median age (around 44) is higher than the national average.
For someone moving to Easton now, the city offers a stable, family-oriented community with a slower pace and a genuinely small-town feel. The population is becoming more diverse, but the change is gradual and not disruptive. The dominant character remains that of a traditional Eastern Shore county seat: conservative-leaning, civically engaged, and centered on schools, churches, and local events like the Waterfowl Festival. New arrivals will find a place where neighbors know each other, crime is low, and the biggest adjustment is the quiet.
* Values derived from national, state, county, city and local statistics and may differ in a specific area. Last updated: 2026-04-22T01:12:56.000Z
Narrative content on this page is AI-generated and may contain mistakes. Verify any details that matter before acting on them.
ReloMaps may earn a commission from affiliate links at no extra cost to you.