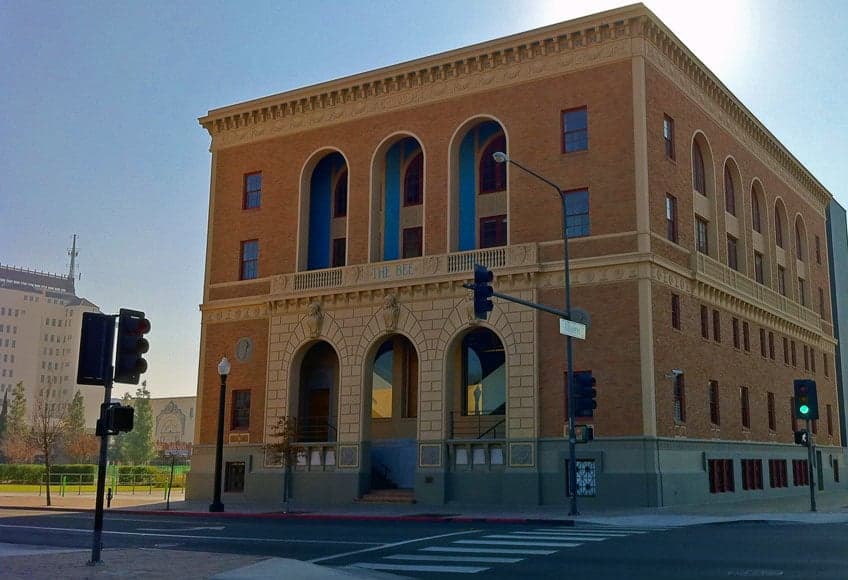
Photo: Wikipedia
Quality of Life in Fresno, CA
Above-average quality of iife. The area offers a reasonable cost of living, decent mobility, and a mix of neighborhood amenities.
What does Quality of Life tell us?
Quality of Life blends cost of living, nearby amenities, socioeconomic signals, and neighborhood character. City-level scores represent the whole municipality; individual neighborhoods can differ.
What does this tell us?
Quality of Life blends cost of living, nearby amenities, socioeconomic signals, and neighborhood character. City-level scores represent the whole municipality; individual neighborhoods can differ.
Cost of Living
18% above national average
The Real Cost of Living in Fresno, CA for 2026
| Tier | Individual | Family (4) |
|---|---|---|
| Survival | $21k | $40k |
| Comfortable | $68k | $100k |
| Luxury | $121k+ | $187k+ |
| Elite (Top 5%) | $150k+ | $232k+ |
67%
The Area Signal
A metric tracking the socioeconomic signals of the area.
Hobbies
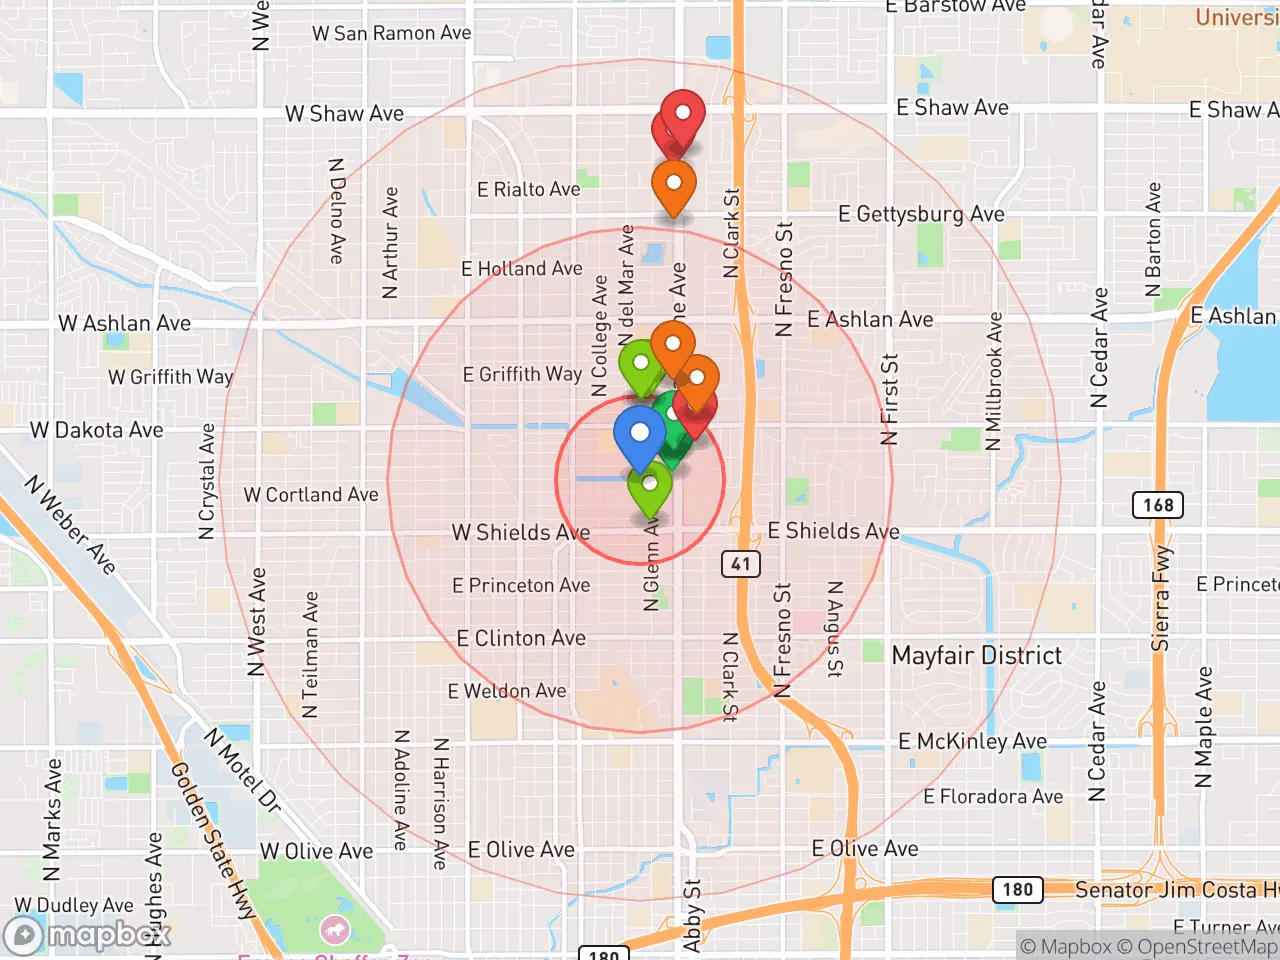
Explore the areaGroceries
6 within 10 miles
Gas
20 within 10 miles
Hospital
16 within 20 miles
Airport
SAN — San Luis Obispo County Regional
Post Office
USPS — Fresno, CA
Critical Amenities
Quality-of-Life Analysis
Fresno, California, presents a quality-of-life profile that is notably more affordable than much of the state, attracting a diverse mix of families, agricultural workers, and professionals priced out of coastal metros. With a cost of living index of 118 (100 = U.S. average), Fresno is significantly cheaper than the California norm, yet its median home value of $348,500 and median rent of $1,324 reflect a market that is still above the national average but far below the Bay Area or Los Angeles. The city's population skews younger and more family-oriented than the state average, with a strong Hispanic and Hmong community presence shaping its cultural and economic fabric.
Cost of living, housing affordability, and how Fresno compares to nearby cities
Fresno's cost of living index of 118 is a bargain by California standards—San Francisco's index is roughly 170, and Los Angeles sits near 150. The median home value of $348,500 is about half of the statewide median of $700,000, making homeownership attainable for many middle-income households. Median rent of $1,324 is roughly 30% lower than the California average of $1,900, though it has risen 15% since 2020. Compared to nearby cities, Fresno is cheaper than Clovis (median home value $420,000) but more expensive than rural towns like Selma ($280,000). The average commute of 22.3 minutes is notably shorter than the California average of 30 minutes, a direct result of the city's less congested road network and the prevalence of local agricultural and service-sector jobs. However, property taxes are effectively higher than in many states due to California's 1% base rate plus local assessments, and state income tax (up to 13.3%) remains a factor for higher earners.
Schools, amenities, and what daily life is like for families
Daily life in Fresno revolves around its role as the economic hub of the San Joaquin Valley, with major employers including Fresno Unified School District, Community Medical Centers, and Amazon's local fulfillment centers. The city's public schools are mixed: Fresno Unified serves 74,000 students with a graduation rate of 83%, below the state average of 87%, while the Clovis Unified School District (serving northern Fresno) posts a 95% graduation rate and is consistently ranked among California's top districts. For higher education, Fresno State (California State University, Fresno) enrolls 25,000 students and anchors the local economy. Amenities include the Fresno Chaffee Zoo, Woodward Park (a 300-acre regional park), and the Fresno Grizzlies minor league baseball team. The city's location at the base of the Sierra Nevada provides 90-minute access to Yosemite National Park and Kings Canyon National Park, a major draw for outdoor enthusiasts. The climate features hot, dry summers (average July high of 98°F) and mild winters, but air quality is a persistent concern—Fresno ranks among the worst in the nation for ozone and particulate matter, with an average of 50 unhealthy air days per year.
Fresno is best suited for families and professionals who prioritize affordability and outdoor access over coastal amenities and pristine air quality. The city works well for those employed in agriculture, healthcare, education, or logistics, and for remote workers seeking a lower-cost base near national parks. Retirees on fixed incomes may find the cost of living manageable, but the extreme summer heat and poor air quality are significant drawbacks. Singles and young professionals without family ties may find the social scene limited compared to larger metros, though the growing food scene (notably the Fresno Taco Trail) and low commute times offer compensating advantages. Ultimately, Fresno delivers a solid middle-class lifestyle at a price point that is increasingly rare in California, provided the trade-offs in air quality and summer heat are acceptable.
Crime in Fresno, CA
WARNING: The crime statistics are unreliable for this jurisdiction. Local authorities have either not reported or under reported their data to the FBI. This could be due to bad intentions, incompetence or technical issues. Regardless, we suggest skepticism.
Significantly higher crime rates than 82% of comparable U.S. locations.
Violent CrimeViolent Crime Analysis
Property CrimeProperty Crime Analysis
Crime Analysis
Fresno’s overall safety picture is mixed, with a violent crime rate of 328.5 per 100,000 residents that sits below the national average but a property crime rate of 1,394.1 per 100,000 that significantly exceeds it. While not among California’s most dangerous cities, Fresno’s crime landscape is heavily shaped by its status as a large metropolitan hub and the progressive judicial policies common in the state’s urban counties. Readers should be aware that the local justice system’s focus on rehabilitation and reduced incarceration, while intended to address root causes, has contributed to higher recidivism and a perception that property crimes are not taken seriously.
Crime in context
Fresno’s violent crime rate of 328.5 per 100,000 is roughly 10% lower than the national average of about 370 per 100,000, and well below California’s statewide rate of approximately 440 per 100,000. However, the property crime rate of 1,394.1 per 100,000 is nearly 40% higher than the national average of roughly 1,000 per 100,000. This disparity is typical of large California metros where progressive district attorneys and judges have deprioritized prosecution for theft, burglary, and vehicle break-ins. Proposition 47, which reclassified many nonviolent felonies as misdemeanors, has been a major driver of this trend, and Fresno County has not been immune to its effects. The result is a property crime environment that feels more acute than the raw numbers suggest, particularly for residents who rely on their cars or homes for daily life.
What residents experience
For Fresno residents, the most tangible safety concern is property crime. Vehicle theft and burglary are the most frequently reported offenses, with many incidents occurring in parking lots, apartment complexes, and along major corridors like Shaw Avenue and Blackstone Avenue. Violent crime, while less common, is concentrated in specific neighborhoods and often tied to gang activity or domestic disputes, rather than random attacks on strangers. The progressive approach of the Fresno County District Attorney’s office—which emphasizes diversion programs and reduced sentencing for nonviolent offenders—means that repeat property offenders are frequently back on the street within days. This creates a cycle where residents feel that reporting theft is futile, and many have invested in security cameras, steering wheel locks, and gated parking as a matter of routine.
Neighborhood-level variation
Safety in Fresno varies dramatically by neighborhood. The affluent, newer areas of north Fresno—such as the neighborhoods near River Park and along Friant Road—experience significantly lower crime rates, often with violent crime below 150 per 100,000 and property crime closer to the national average. In contrast, central and southwest Fresno, including areas like the Tower District and West Fresno, see violent crime rates that can exceed 500 per 100,000, driven by poverty and gang presence. The city’s sprawling layout means that a few miles can separate a very safe block from a high-risk one. For newcomers, choosing a neighborhood north of Herndon Avenue is the most reliable way to minimize exposure to crime, while areas near downtown and Highway 99 require more vigilance, especially at night.
* Values derived from national, state, county, city and local statistics and may differ in a specific area. Last updated: 2026-04-30T07:51:53.000Z
Narrative content on this page is AI-generated and may contain mistakes. Verify any details that matter before acting on them.
ReloMaps may earn a commission from affiliate links at no extra cost to you.