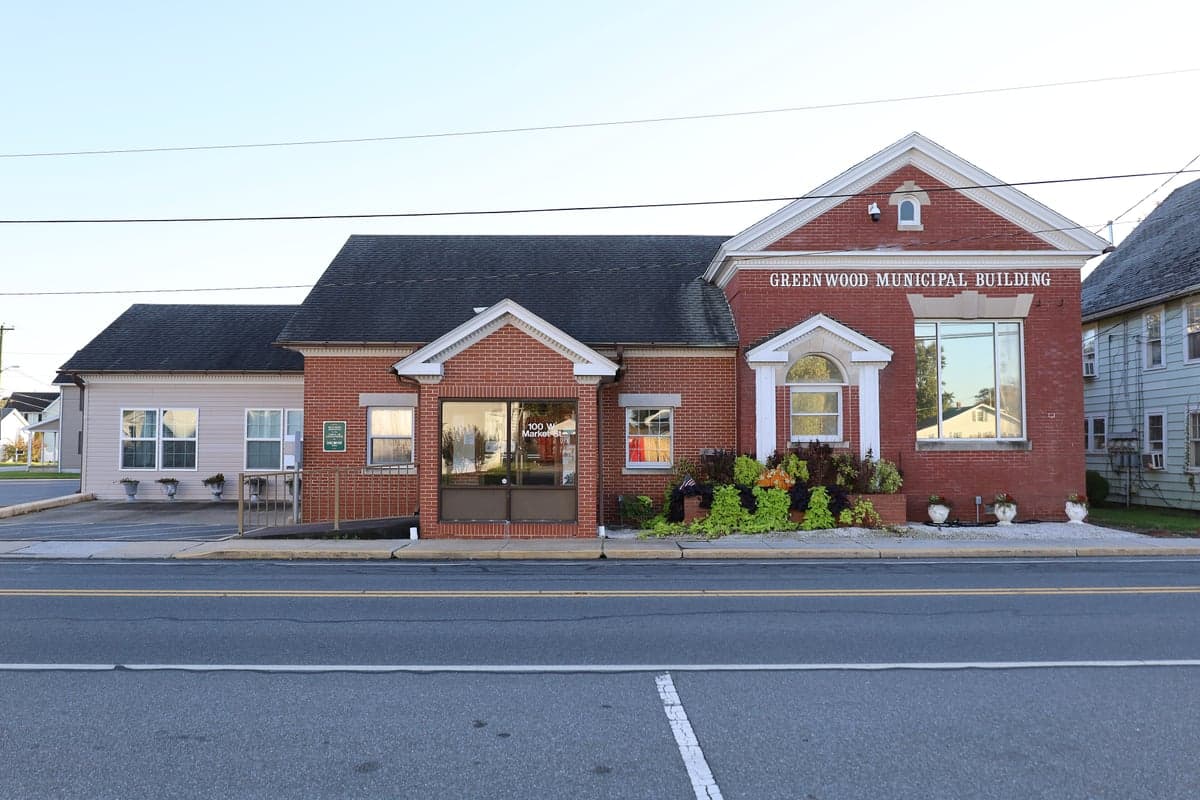
Photo: Wikipedia
Demographics of Greenwood, DE
Affluence Level in Greenwood, DE
A middle-class area roughly in line with national averages across income, home values, education, and employment.
People of Greenwood, DE
The people of Greenwood, Delaware today form a compact, working-class community of roughly 1,800 residents, notable for its unusual tri-ethnic balance: White residents make up 42.3% of the population, Black residents 27.8%, and Hispanic residents 26.8%. The foreign-born share stands at 14.2%, well above the state average, yet the college-educated rate is just 13.8%, reflecting a town built around manual labor and small-scale agriculture rather than white-collar professions. Greenwood’s identity is shaped by its position as a crossroads community in western Sussex County, where three distinct population streams—native-born White families, African Americans with deep local roots, and a growing Hispanic workforce—coexist in a town small enough that daily life forces interaction across ethnic lines.
How the city was settled and grew
Greenwood was founded in the 1850s as a railroad stop on the Delaware Railroad, which connected the agricultural interior of Sussex County to markets in Wilmington and beyond. The original settlers were predominantly White farmers of English and Scots-Irish descent, drawn by cheap land in the Nanticoke River watershed. The town was formally incorporated in 1861, and its early economy revolved around canneries, sawmills, and fruit packing—industries that required seasonal labor. By the early 1900s, a small African American community had formed in the South Railroad Avenue area, working as farmhands and domestic laborers for White landowners. The West Market Street corridor became the commercial spine, while White working-class families settled along East Avenue and North Street. The town remained overwhelmingly White through the 1950 census, with Black residents comprising roughly 15% of the population and no significant Hispanic presence.
Modern era (post-1965)
The post-1965 period brought two transformative shifts. First, the mechanization of agriculture and the decline of local canneries pushed many White and Black families to seek work in larger towns like Seaford and Georgetown, slowing Greenwood’s growth. Second, the 1980s and 1990s saw the arrival of Hispanic immigrants, primarily from Mexico and Central America, who were recruited by the region’s poultry processing plants and produce farms. These newcomers settled in the Westville Avenue and Old Bridgeville Road areas, renting older homes and mobile homes near the industrial zones. By 2000, the Hispanic share had reached roughly 12%, and by 2020 it had climbed to 26.8%, driven by both immigration and higher birth rates. The Black population remained stable at around 28%, concentrated in the South Railroad Avenue and East Avenue neighborhoods, while the White share dropped from over 70% in 1990 to 42.3% today. The East/Southeast Asian population is negligible at 0.7%, and there is no measurable Indian-subcontinent community. The foreign-born share of 14.2% is almost entirely Hispanic, making Greenwood one of the most ethnically diverse small towns in Sussex County.
The future
Greenwood’s population is trending toward a tri-ethnic equilibrium rather than homogenization. The Hispanic share is likely to continue growing slowly, driven by family reunification and the steady demand for labor in poultry processing and agriculture, but the town lacks the housing stock or economic dynamism to attract large new waves. The White population is aging and declining in absolute numbers, as younger White adults leave for college and jobs in the Wilmington or Salisbury metro areas. The Black population is stable but aging as well, with limited in-migration. There is no evidence of new immigrant communities from Asia, the Indian subcontinent, or the Middle East forming. The town is not tribalizing into distinct enclaves—its small size and limited housing options mean that West Market Street and South Railroad Avenue remain mixed, though informal social networks still cluster by ethnicity. The next 10-20 years will likely see Greenwood remain a stable, low-growth town of 1,800-2,000 people, with a slowly rising Hispanic plurality and a continued decline in the White share.
For someone moving in now, Greenwood is a place where ethnic diversity is a daily reality but economic opportunity is limited. The town offers affordable housing and a quiet, rural lifestyle, but the low college attainment rate and reliance on manual labor mean that upward mobility is constrained. New residents should expect a community where neighborly interaction is common across ethnic lines, but where the three main groups—White, Black, and Hispanic—still maintain distinct social worlds. Greenwood is not becoming a melting pot; it is becoming a stable, small-town mosaic.
* Values derived from national, state, county, city and local statistics and may differ in a specific area. Last updated: 2026-04-29T23:15:31.000Z
Narrative content on this page is AI-generated and may contain mistakes. Verify any details that matter before acting on them.
ReloMaps may earn a commission from affiliate links at no extra cost to you.