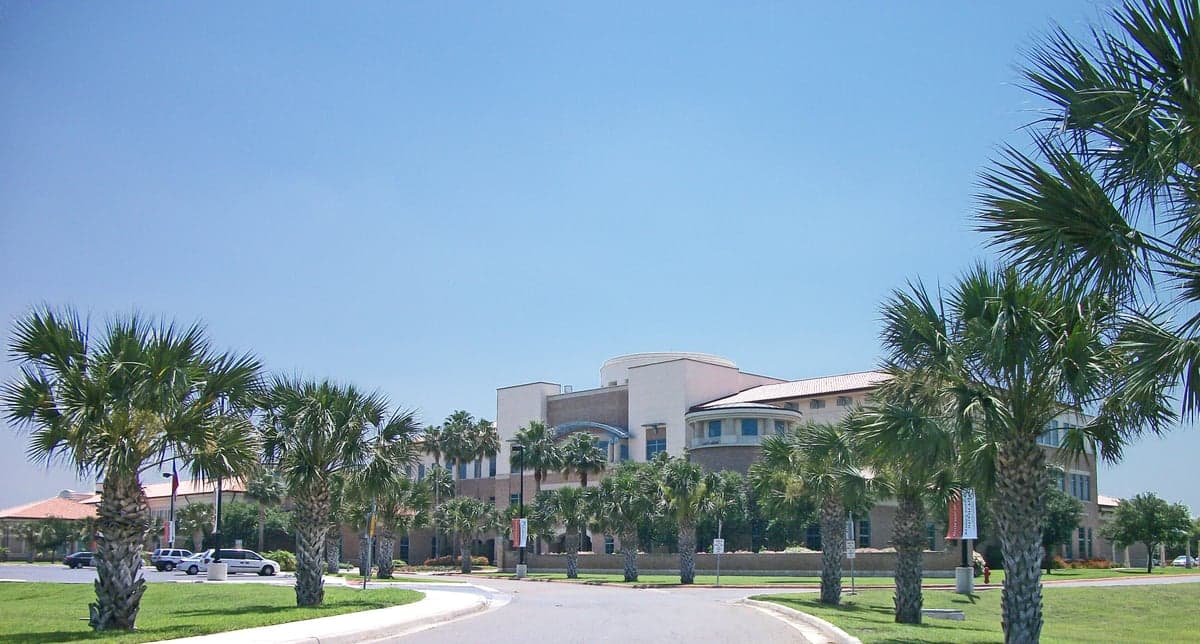
Photo: Wikipedia
Demographics of Harlingen, TX
Affluence Level in Harlingen, TX
A below-average socioeconomic profile. Incomes, home values, and educational attainment trail the U.S., with higher poverty and unemployment.
People of Harlingen, TX
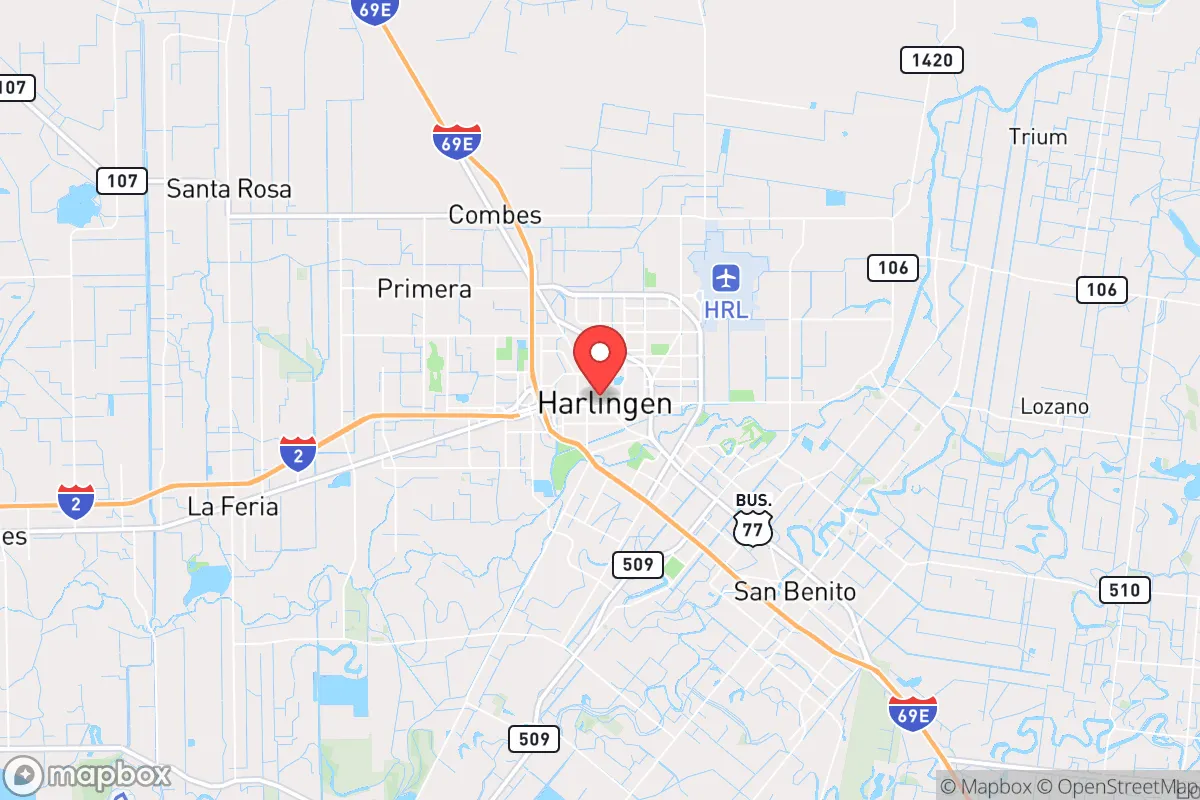
The people of Harlingen, Texas today form a predominantly Hispanic community of 71,669 residents, with 82.2% identifying as Hispanic or Latino, 14.5% as White alone, and small but distinct Asian (0.7%) and Indian (0.4%) populations. The city carries a strong border-region identity—bilingual, family-oriented, and rooted in agriculture and healthcare—while its 7.5% foreign-born share reflects a steady but moderate immigrant presence compared to other Rio Grande Valley cities. Harlingen’s population density is moderate for the Valley, and its character is notably more suburban and retiree-friendly than neighboring Brownsville or McAllen, with a distinctive "mid-Valley" feel that blends old farming communities with newer master-planned subdivisions.
How the city was settled and grew
Harlingen was founded in 1904 as a railroad hub for the St. Louis, Brownsville and Mexico Railway, drawing its first wave of settlers from the Midwestern United States—primarily Anglo farmers and businessmen attracted by land grants and the promise of irrigated agriculture in the Rio Grande Valley. These early Anglo settlers established the original downtown core around the railroad depot, an area now known as Historic Downtown Harlingen, where many of the city’s oldest commercial buildings still stand. By the 1910s and 1920s, Mexican and Mexican-American laborers arrived in large numbers to work the cotton, citrus, and vegetable fields, settling in what became the Southmost and East Jackson Street neighborhoods—working-class areas that remain predominantly Hispanic today. The 1930s through 1950s saw a second wave of Anglo migration, including veterans and retirees drawn by the warm climate and low cost of living, who clustered in the Loma Alta and Sun Valley subdivisions north of the railroad tracks. By 1960, Harlingen’s population was roughly 60% Anglo and 40% Hispanic, a ratio that would reverse dramatically in the following decades.
Modern era (post-1965)
The 1965 Hart-Cellar Immigration Act, combined with the expansion of the maquiladora industry along the border, triggered a sustained influx of Mexican and Mexican-American families into Harlingen after 1970. This wave settled primarily in the Westside neighborhoods—areas west of U.S. 77 and south of Loop 499—where new subdivisions like Palm Valley and Colonial Hills filled with first- and second-generation Hispanic families. Simultaneously, the city’s Anglo population began a slow out-migration to newer suburbs such as Rancho Viejo (an unincorporated area just north of Harlingen) and to retirement communities in the Victoria Palms district, a master-planned 55+ neighborhood that remains predominantly White. The Asian population, though small at 0.7%, is concentrated in the East Harlingen area near the Valley Baptist Medical Center, where a handful of Filipino and Vietnamese healthcare professionals have settled since the 1990s. The Indian subcontinent population (0.4%) is similarly tied to the medical sector, with families living scattered across the city rather than in a single enclave. By 2020, the Hispanic share had risen to over 80%, while the White share dropped below 15%—a demographic shift driven by both continued Hispanic in-migration and Anglo out-migration to outlying communities.
The future
Harlingen’s population is likely to continue its gradual Hispanicization, with the White share projected to fall below 10% by 2040 as older Anglo residents age out and younger Hispanic families move in from the surrounding Valley. The foreign-born share (7.5%) is stable but not growing rapidly, suggesting that the city is absorbing new arrivals through natural increase rather than high immigration—a pattern that points toward assimilation rather than the creation of new ethnic enclaves. The Asian and Indian populations are expected to grow modestly, driven by the expansion of Valley Baptist Medical Center and the University of Texas Rio Grande Valley’s Harlingen campus, but will likely remain small and dispersed rather than forming distinct neighborhoods. The city is not tribalizing into sharply divided enclaves; instead, it is homogenizing into a predominantly Hispanic, middle-class, suburban community, with the main internal divide being between older working-class barrios (Southmost, Westside) and newer master-planned subdivisions (Palm Valley, Victoria Palms).
For someone moving to Harlingen now, the city offers a stable, family-oriented environment where Spanish and English blend seamlessly, the cost of living remains low, and the population is overwhelmingly Hispanic and culturally conservative. The Anglo presence is shrinking but not hostile, and the small Asian and Indian communities are integrated rather than isolated. Harlingen is becoming a solidly Hispanic, middle-American city—less a border town than a regional hub for healthcare, agriculture, and retirement, with a demographic future that looks much like its present, only more so.
* Values derived from national, state, county, city and local statistics and may differ in a specific area. Last updated: 2026-05-12T00:03:21.000Z
Narrative content on this page is AI-generated and may contain mistakes. Verify any details that matter before acting on them.
ReloMaps may earn a commission from affiliate links at no extra cost to you.