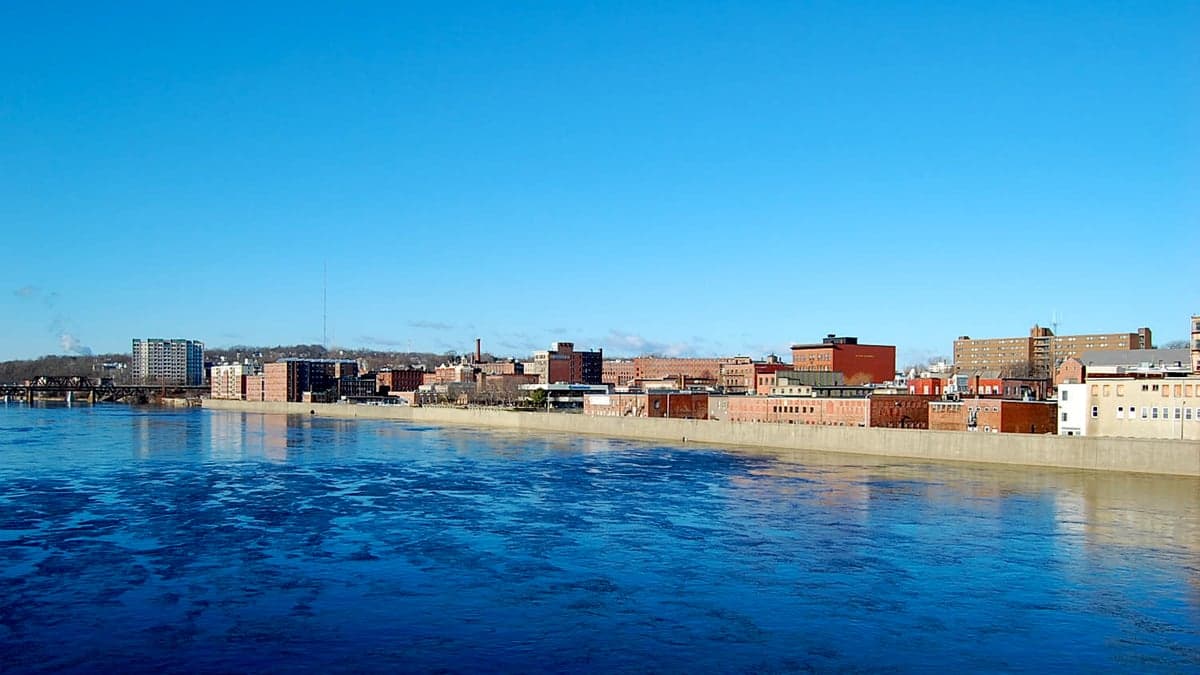
Photo: Wikipedia
Demographics of Haverhill, MA
Affluence Level in Haverhill, MA
A middle-class area roughly in line with national averages across income, home values, education, and employment.
People of Haverhill, MA
The people of Haverhill, Massachusetts today form a city of 67,387 residents that is notably more diverse than its rural Essex County surroundings, with a population that is 64.7% white, 26.4% Hispanic, 2.6% Black, 0.9% East/Southeast Asian, and 0.4% Indian (subcontinent). Only 5.5% of residents are foreign-born, a figure well below the state average, indicating that most of the city’s diversity comes from domestic migration and second-generation growth rather than recent international arrivals. The city retains a distinct working-class character rooted in its industrial past, with a median household income around $73,000 and a college attainment rate of 31.6% that lags behind the Boston metro area. Haverhill’s identity is shaped by its Merrimack River corridor, historic downtown, and a patchwork of neighborhoods that reflect successive waves of immigration and suburban flight.
How the city was settled and grew
Haverhill was founded in 1640 as a farming and fishing settlement along the Merrimack River, drawing English Puritan families from the coastal towns of Newbury and Ipswich. The original population clustered near the riverfront in what is now the Downtown and Water Street district, where the first meeting house and wharves were built. The city’s explosive growth came in the 19th century with the shoe and hat manufacturing industries, which attracted waves of Irish immigrants fleeing the Great Famine in the 1840s and 1850s. These Irish families settled primarily in the Mount Washington and Ayers Village neighborhoods, building St. James and St. Michael’s parishes that remain anchors today. French-Canadian workers arrived from Quebec between 1870 and 1910, drawn by the same shoe factories, and concentrated in the Bradford district (the area west of the river that was a separate town until 1897), where they established St. Joseph’s Church and a distinct Franco-American identity. Smaller numbers of Italian and Polish immigrants arrived in the early 1900s, settling in the Riverside and Monument Square areas near the factories. By 1920, Haverhill’s population had reached 53,000, and the city was overwhelmingly white, native-born, and Catholic.
Modern era (post-1965)
The post-1965 period brought two major demographic shifts. First, the collapse of the shoe industry in the 1970s and 1980s triggered white flight to surrounding towns like Plaistow, NH and Boxford, leaving behind an aging, lower-income population in the core neighborhoods. Second, the 1990s and 2000s saw a surge of Hispanic migration, primarily Puerto Rican and Dominican families moving from Boston and Lawrence for cheaper housing and factory jobs in the remaining light manufacturing and warehousing sectors. These new residents concentrated in the Downtown and Mount Washington areas, where older housing stock and proximity to bus lines made settlement practical. The Hispanic share of Haverhill’s population rose from roughly 5% in 1990 to 26.4% by 2024. The East/Southeast Asian population (0.9%) is small but visible in the Bradford area, where a handful of Vietnamese and Chinese families have opened restaurants and nail salons. The Indian subcontinent population (0.4%) is even smaller, with most families living in the newer subdivisions near the I-495 corridor in the western part of the city. The Black population (2.6%) is dispersed but slightly concentrated in the Downtown census tracts. The foreign-born share has remained low (5.5%) because most Hispanic growth has come from U.S.-born Puerto Ricans and second-generation families, not new immigrants.
The future
Haverhill’s population is projected to grow modestly to around 72,000 by 2040, driven by two opposing forces. On one side, the Hispanic share is likely to continue rising, potentially reaching 35-40% by 2040, as younger families replace an aging white population (the median age of white residents is 44, versus 28 for Hispanic residents). This growth is concentrated in the Downtown and Mount Washington neighborhoods, which are becoming increasingly Hispanic-majority. On the other side, the city is seeing a modest influx of younger, college-educated professionals priced out of Boston and Cambridge, who are buying homes in the Bradford and Riverside areas and pushing up property values. This group is predominantly white and Asian, and their arrival is creating a bifurcated city: a gentrifying riverfront corridor and a more working-class, Hispanic interior. The East/Southeast Asian and Indian populations are likely to remain small (under 2% each) unless the city attracts a major employer in tech or healthcare. The foreign-born share may rise slightly as a few refugee families (from Afghanistan, Syria, or Central America) are resettled through local nonprofits, but Haverhill is not a primary gateway city. The overall trend is toward a more Hispanic city, but one that remains residentially segregated by neighborhood and income.
For someone moving to Haverhill now, the city offers a choice between two distinct trajectories. The Bradford and Riverside neighborhoods provide a stable, increasingly professional environment with good schools and commuter rail access to Boston, but at rising home prices. The Downtown and Mount Washington areas offer lower costs and a vibrant Hispanic cultural scene, but with higher crime rates and underperforming schools. The city is not homogenizing; it is tribalizing into separate enclaves defined by ethnicity and income. A conservative-leaning family or individual should evaluate which neighborhood aligns with their priorities for safety, schools, and community character, as the city’s future is not a single story but a collection of diverging ones.
* Values derived from national, state, county, city and local statistics and may differ in a specific area. Last updated: 2026-05-01T05:45:35.000Z
Narrative content on this page is AI-generated and may contain mistakes. Verify any details that matter before acting on them.
ReloMaps may earn a commission from affiliate links at no extra cost to you.