Photo: Wikipedia
Demographics of Miami County
Affluence Level in Miami County
A below-average socioeconomic profile. Incomes, home values, and educational attainment trail the U.S., with higher poverty and unemployment.
People of Miami County
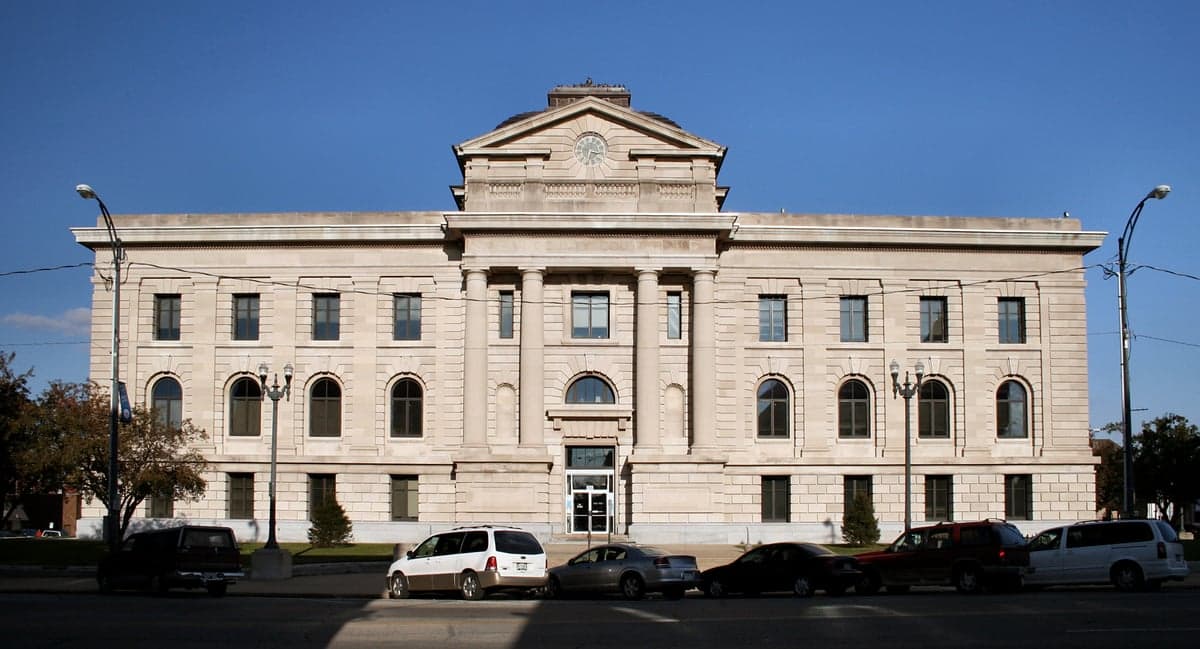
The people of Miami County, Indiana, today number 35,772, forming a predominantly white (87.3%) and rural community with a distinctly small-town, Midwestern character. The county is notably less diverse than the state average, with a foreign-born population of just 1.0% and a college attainment rate of 16.1%, well below the national figure. Its identity is rooted in agricultural heritage, manufacturing history, and a network of small towns—Peru, the county seat, along with Bunker Hill, Converse, and Amboy—that anchor a population that has remained remarkably stable in size over the past century. For a relocating family or individual seeking a quiet, affordable, and culturally traditional environment, Miami County offers a place where community ties run deep and change comes slowly.
Settlement & growth (pre-1960)
Long before European settlement, the area that is now Miami County was the heartland of the Miami people, an Algonquian-speaking nation whose name the county bears. The Miami established villages along the Wabash River and its tributaries, including the significant settlement of Kekionga (near present-day Fort Wayne) and smaller camps near what would become Peru. French fur traders and missionaries passed through the region in the 17th and 18th centuries, establishing trading posts, but significant American settlement did not begin until after the War of 1812 and the subsequent treaties that forced the Miami to cede their lands. The 1826 Treaty of Mississinewas effectively removed the Miami to reservations west of the Mississippi, clearing the way for white homesteaders.
The first major wave of American settlers arrived in the 1830s and 1840s, primarily from the upland South (Kentucky, Tennessee, and Virginia) and the Mid-Atlantic states. These were largely Scots-Irish and English farmers drawn by the promise of fertile, cheap land in the newly surveyed Wabash River valley. They established the county's earliest towns: Peru was platted in 1834 and became the county seat in 1836, while Bunker Hill (1838), Converse (1848), and Amboy (1854) followed as agricultural service centers. The Wabash and Erie Canal, completed through the county in the 1840s, briefly spurred growth by connecting local farms to eastern markets, but the canal era was short-lived.
The second major demographic wave came with the railroads in the 1850s and 1860s. The Lake Erie and Western Railroad (later part of the Nickel Plate Road) and the Wabash Railroad built lines through Peru, transforming it into a regional transportation and manufacturing hub. This period attracted a modest influx of German and Irish immigrants, who worked on railroad construction and in the new foundries and machine shops. By 1870, the county's population had reached roughly 20,000, with Peru emerging as the dominant commercial center. The arrival of the circus industry in the late 19th century—Peru became the winter home of the Hagenbeck-Wallace Circus and later the International Circus Hall of Fame—brought a unique cultural flavor and seasonal employment, but did not fundamentally alter the county's ethnic composition.
The 20th century saw slow, steady growth driven by manufacturing. The Grissom Air Force Base (established as Bunker Hill Naval Air Station in 1942 and later renamed) brought a significant federal presence and a temporary influx of military personnel and civilian workers to the Grissom Air Reserve Base area near Bunker Hill. However, the county's population peaked at around 38,000 in 1960 and has since declined slightly, as agricultural consolidation reduced the need for farm labor and manufacturing jobs shifted elsewhere. Unlike many Indiana counties, Miami County did not experience a large wave of Southern Black migrants during the Great Migration; the Black population remained small, hovering around 3-4% through the mid-20th century, concentrated primarily in Peru.
Modern era (post-1965)
The post-1965 era, shaped by the Hart-Cellar Act, brought only modest demographic change to Miami County. The county's foreign-born population remains at just 1.0%, far below the national average of roughly 14%. The small Hispanic population (3.6%) has grown gradually since the 1990s, driven primarily by Mexican immigrants and their descendants who found work in agriculture, food processing, and light manufacturing. These families have settled mainly in Peru and Bunker Hill, where they form small but visible communities, though no distinct ethnic enclave has emerged. The Black population (3.7%) has remained stable, with most residents living in Peru, often in neighborhoods near the former railroad and industrial zones.
The East/Southeast Asian population (0.6%) and Indian subcontinent population (0.0%) are negligible, reflecting the county's limited draw for high-skilled immigration or tech-sector employment. Domestic migration patterns have been more significant. Since the 1980s, Miami County has experienced a slow but steady outflow of young adults seeking education and jobs in larger cities like Indianapolis (90 minutes south) or Fort Wayne (45 minutes east). This "brain drain" has contributed to the county's low college attainment rate (16.1%). In contrast, the county has attracted some retirees and second-home buyers drawn to the Mississinewa River and the recreational opportunities at Mississinewa Lake and Miami State Recreation Area, particularly around the unincorporated areas of Pekin and Mexico.
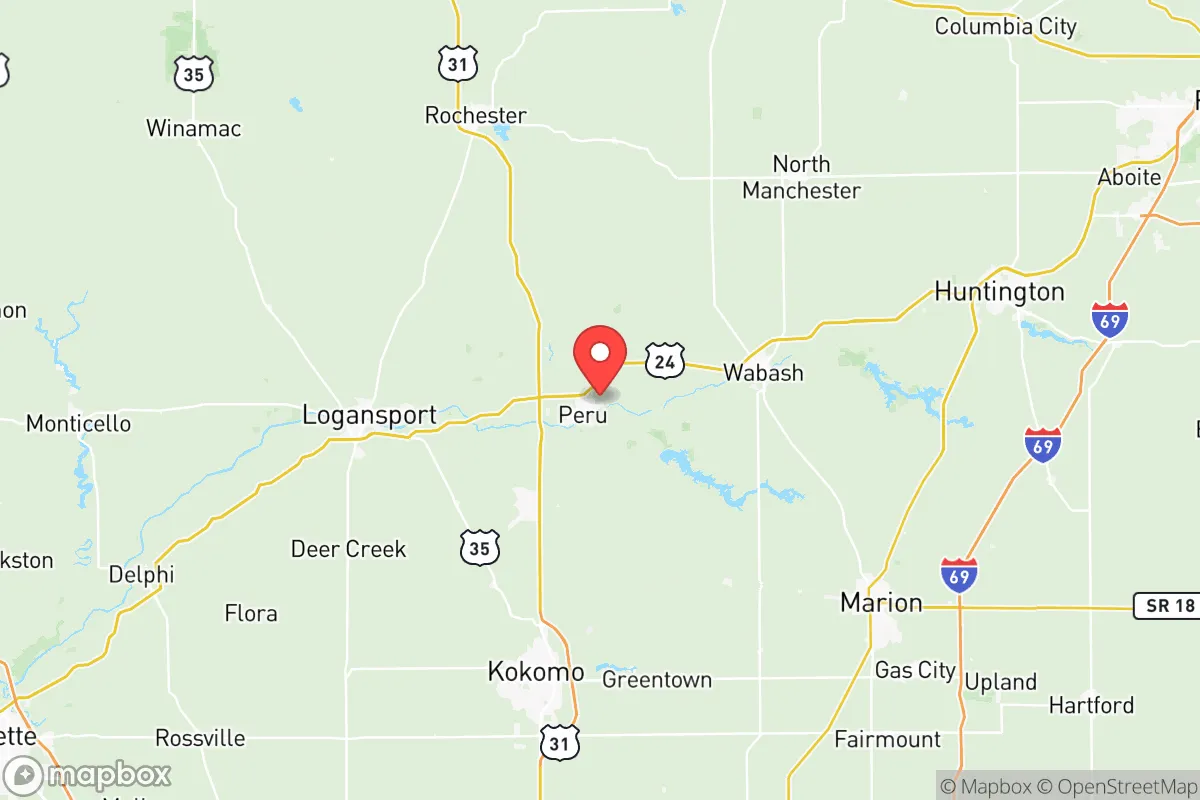
Suburbanization has been limited. While the county is within commuting distance of Kokomo (15 miles south) and Logansport (20 miles west), it has not experienced the explosive exurban growth seen in counties closer to Indianapolis. The towns of Converse and Amboy have seen slight population declines as younger residents move to larger regional centers. The closure of Grissom Air Force Base's active-duty mission in 1994 (it remains a reserve base) removed a key economic driver and a source of demographic diversity, though the base's presence still brings some military-affiliated families to the area.
The future
Miami County's population is projected to remain stable or decline slightly over the next 10-20 years, mirroring trends across much of rural Indiana. The county's age structure is older than the state average, with a median age of approximately 42, and natural increase (births minus deaths) is likely to be negative or flat. The Hispanic population is expected to grow modestly, potentially reaching 5-6% by 2040, as younger families move in for agricultural and manufacturing jobs. However, the county is unlikely to see significant diversification from international immigration, given its lack of urban amenities and limited job growth in sectors that attract foreign-born workers.
The cultural identity of Miami County will likely remain rooted in its agricultural and small-town heritage, with a conservative political leaning that aligns with the broader region. The county voted heavily Republican in recent presidential elections, and social values tend toward the traditional. For newcomers, this means a community where church attendance, volunteer fire departments, and high school sports remain central to social life. The biggest demographic wildcard is the potential for remote work to attract new residents seeking lower housing costs and a slower pace of life; if that trend accelerates, the county could see modest in-migration from urban areas, particularly to lakefront properties near Mississinewa Lake.
Bottom-line: Miami County is becoming a quieter, older, and slightly more Hispanic version of its current self—a stable, predominantly white, rural community where change is gradual and tradition holds sway. For someone moving in now, the appeal lies in affordable housing, low crime, and a strong sense of place, but the trade-off is limited economic opportunity, low diversity, and a population that is slowly shrinking. It is a place best suited for those who value rootedness over dynamism, and who are comfortable in a community where most people have known each other for generations.

* Values derived from national, state, county, city and local statistics and may differ in a specific area. Last updated: 2026-08-19T02:22:50.000Z
Narrative content on this page is AI-generated and may contain mistakes. Verify any details that matter before acting on them.
ReloMaps may earn a commission from affiliate links at no extra cost to you.

