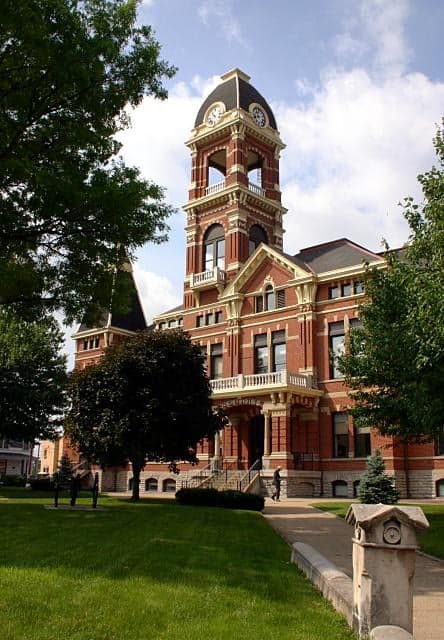
Photo: Wikipedia
Demographics of Campbell County
Affluence Level in Campbell County
A middle-class area roughly in line with national averages across income, home values, education, and employment.
People of Campbell County
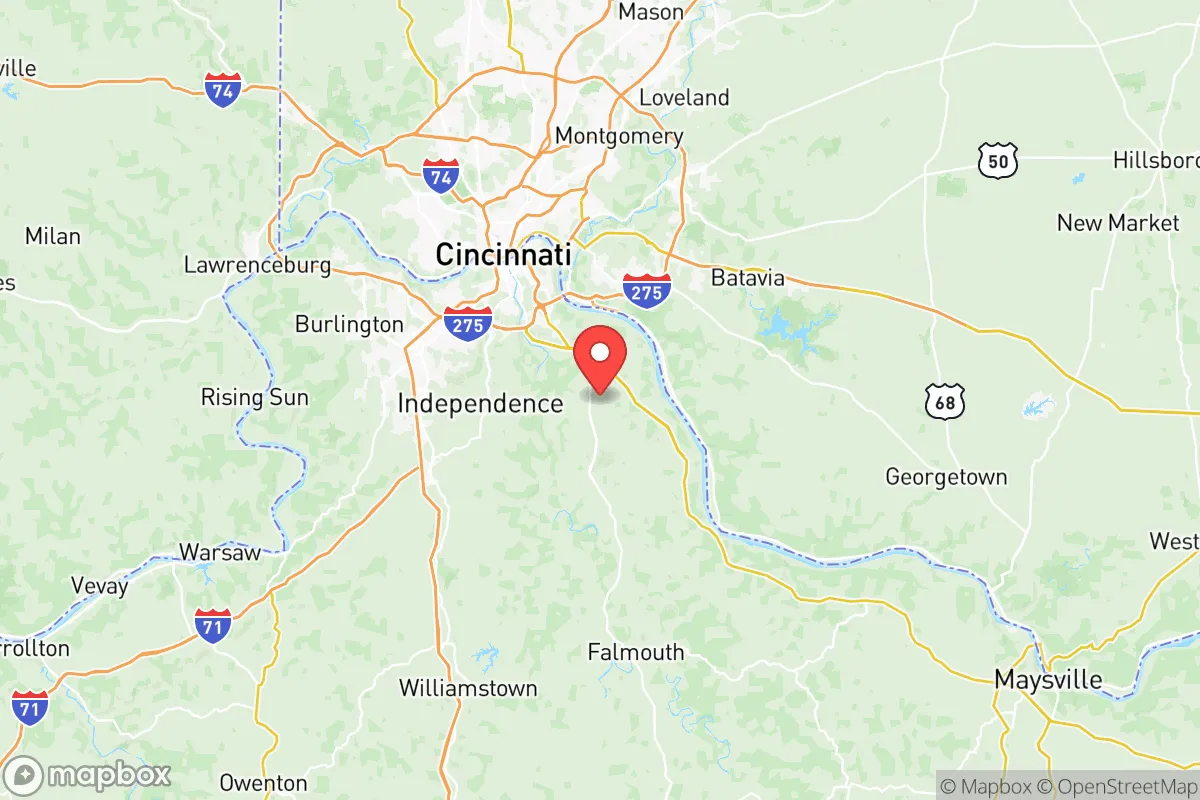
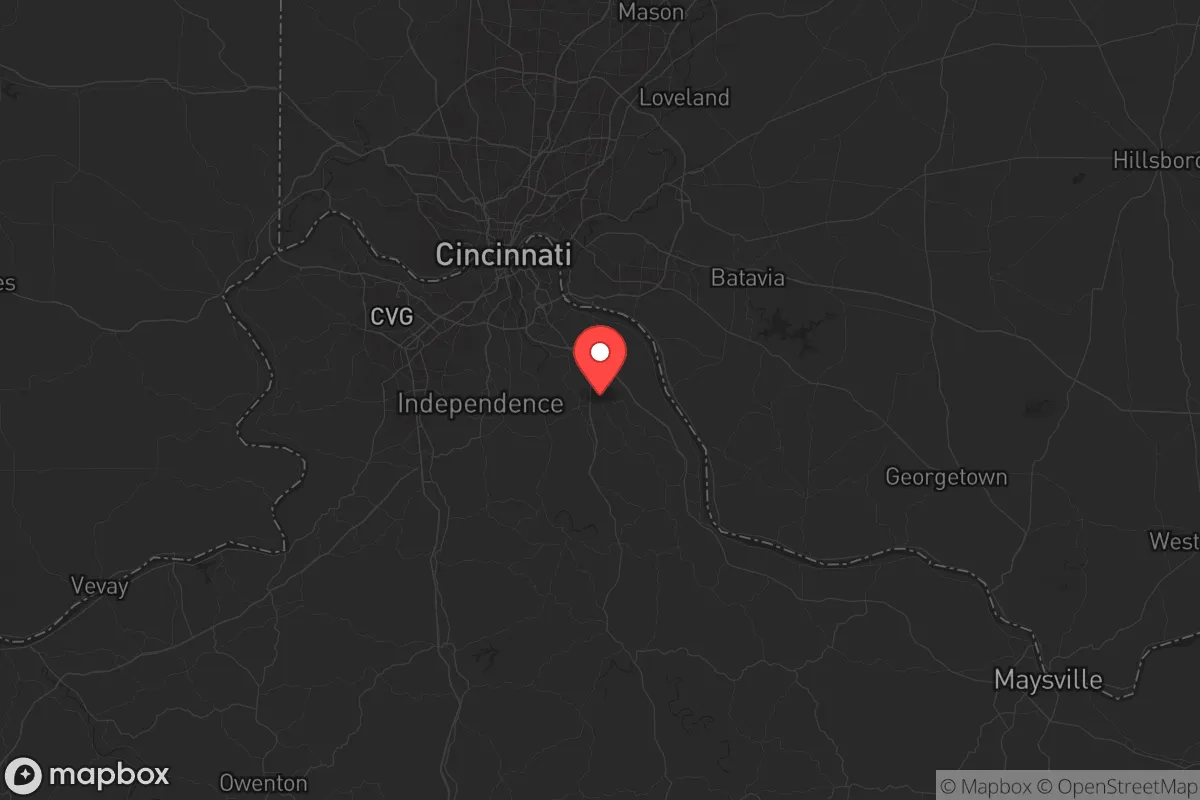
Campbell County, Kentucky, today is a predominantly white, suburban-leaning community of 93,193 residents, characterized by its historic river towns and a strong sense of local identity rooted in Northern Kentucky’s German-Catholic heritage. With a foreign-born population of just 1.4% and a 90.7% white demographic, the county remains one of the least ethnically diverse in the Cincinnati metro area, yet it is increasingly college-educated (39.5%) and politically moderate-conservative. Distinctive markers include the historic riverfront cities of Newport and Covington, the suburban bedroom communities of Fort Thomas and Alexandria, and a population that is both deeply rooted in its 19th-century immigrant past and slowly diversifying through domestic in-migration.
Settlement & growth (pre-1960)
Before American settlement, the area now known as Campbell County was inhabited by the Shawnee and Miami nations, who used the Ohio River as a travel and trade corridor. French explorers and fur traders passed through as early as the 17th century, but no permanent European settlements were established until after the American Revolution. The county was formally created in 1794 from parts of Scott and Mason counties, named after Colonel John Campbell, a Revolutionary War officer.
The first major wave of American settlers arrived between 1790 and 1820, primarily of Scots-Irish and English stock, moving south and west from Pennsylvania and Virginia via the Ohio River. These early pioneers were farmers and small traders who established the first river landings that would become Newport and Covington. Newport, founded in 1795 at the confluence of the Ohio and Licking Rivers, quickly grew as a river port and military outpost, with Fort Thomas later established as a major U.S. Army post in 1887.
The defining demographic wave, however, came with German immigration between 1830 and 1890. Thousands of German Catholics and Lutherans, fleeing economic hardship and political unrest in the German states, settled directly in Newport, Covington, and the surrounding farmlands. By 1850, German-born residents made up roughly one-third of Covington’s population. These immigrants brought with them a strong Catholic identity, brewing traditions, and a work ethic that shaped the region’s industrial base. The German influence remains visible today in the historic churches of Covington’s Main Strasse district and the annual Oktoberfest celebrations in Newport.
A smaller but significant Irish immigration wave occurred during the same period, particularly after the Great Famine of the 1840s. Irish laborers settled in Newport and Covington, working on the Ohio River docks, the Licking River bridges, and the construction of the Cincinnati Southern Railway. By 1860, Irish immigrants constituted about 10% of Campbell County’s population, concentrated in the riverfront neighborhoods of Newport’s East Row and Covington’s West Side.
From 1900 to 1960, the county’s growth was driven by industrial expansion along the Ohio River, including the Newport Steel plant and various manufacturing facilities in Wilder and Dayton. This period saw limited new immigration, with the population remaining overwhelmingly white and native-born. The Great Migration of African Americans from the South largely bypassed Campbell County, as the region’s industrial jobs were already filled by established white ethnic groups. The county’s black population never exceeded 3% during this era, a pattern that persists today. Suburbanization began in earnest after World War II, with new housing developments spreading into Fort Thomas, Highland Heights, and Cold Spring, drawing families from the aging riverfront cities.
Modern era (post-1965)
The 1965 Hart-Cellar Act, which dramatically expanded non-European immigration, had a minimal direct impact on Campbell County. Unlike the major metropolitan gateways, the county’s foreign-born population remained stagnant at around 1-2% through the 1970s and 1980s. The small Asian community that exists today—0.5% East/Southeast Asian and 0.5% Indian—is largely a product of professional migration to the Cincinnati region, with families settling in the more suburban areas of Fort Thomas and Alexandria rather than forming distinct ethnic enclaves. The Hispanic population, at 2.5%, is similarly dispersed and modest, with no concentrated barrio or colonia.
The most significant demographic shift since 1965 has been domestic: the continued suburbanization of the county’s population away from the historic river cities. Newport and Covington, once the population centers, have seen their share of county residents decline as families moved to newer subdivisions in Alexandria, Cold Spring, and Wilder. This pattern accelerated in the 1990s and 2000s as Interstate 275 and the AA Highway made commuting to Cincinnati easier. The county’s black population, at 2.8%, remains small and is concentrated in Newport and Covington, reflecting the limited historical presence of African Americans in the region.
The college-educated share has risen sharply from roughly 20% in 1990 to 39.5% today, driven by the expansion of Northern Kentucky University in Highland Heights and the growth of professional services and healthcare employment in the Cincinnati metro area. This educational shift has made Campbell County more politically competitive, though it still leans Republican in most elections, with a cultural conservatism rooted in its Catholic and military heritage.
The future
Campbell County’s population is projected to grow slowly, reaching approximately 100,000 by 2040, driven primarily by domestic in-migration from higher-cost areas of Ohio and the East Coast. The foreign-born share is likely to remain below 3%, as the county lacks the ethnic networks and entry-level job base that attract new immigrants. The Hispanic and Asian populations will grow incrementally but will remain small minorities, assimilating into the broader white suburban culture rather than forming distinct enclaves.
The county is not tribalizing into ethnic enclaves but is instead experiencing a gradual homogenization of its suburban areas, with Alexandria and Cold Spring absorbing most new growth. The historic river cities of Newport and Covington are seeing a modest urban revival, attracting younger professionals and empty-nesters, but this is a lifestyle shift rather than a demographic one. The cultural identity of the county—rooted in German-Catholic traditions, military service, and a pragmatic conservatism—is likely to persist, as in-migrants tend to be drawn to the area precisely because of its stability and family-oriented character.
For someone moving in now, Campbell County offers a stable, predominantly white, and culturally conservative community with good schools in Fort Thomas and Beechwood, a growing college-educated workforce, and a cost of living that remains below the national average. The population is not becoming more diverse in any meaningful sense, but it is becoming more educated and suburban, with the historic river towns serving as cultural anchors rather than demographic centers. The county is likely to remain what it has been for over a century: a solidly middle-class, family-oriented suburb of Cincinnati, with a strong sense of place and a population that values continuity over change.
* Values derived from national, state, county, city and local statistics and may differ in a specific area. Last updated: 2026-05-13T08:42:12.000Z
Narrative content on this page is AI-generated and may contain mistakes. Verify any details that matter before acting on them.
ReloMaps may earn a commission from affiliate links at no extra cost to you.