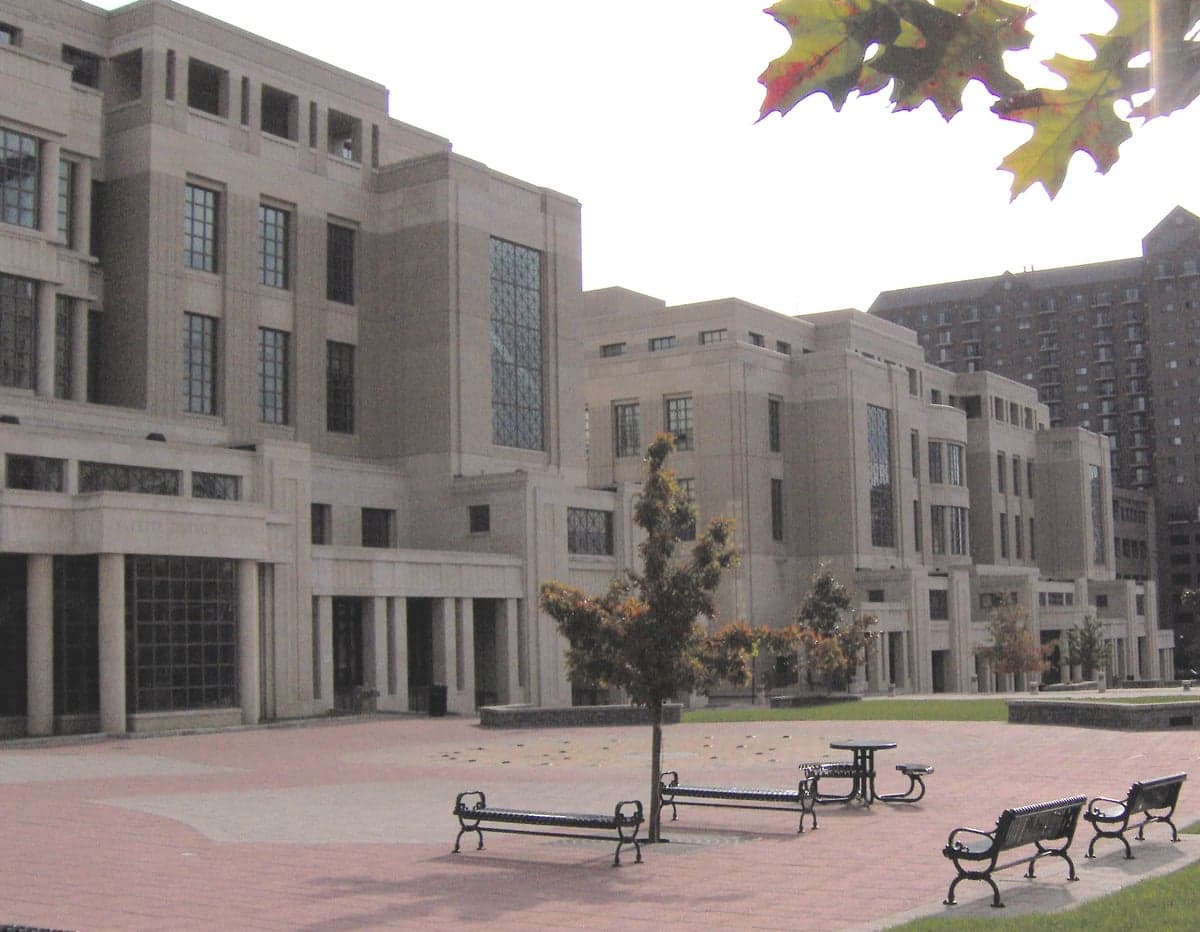
Photo: Wikipedia
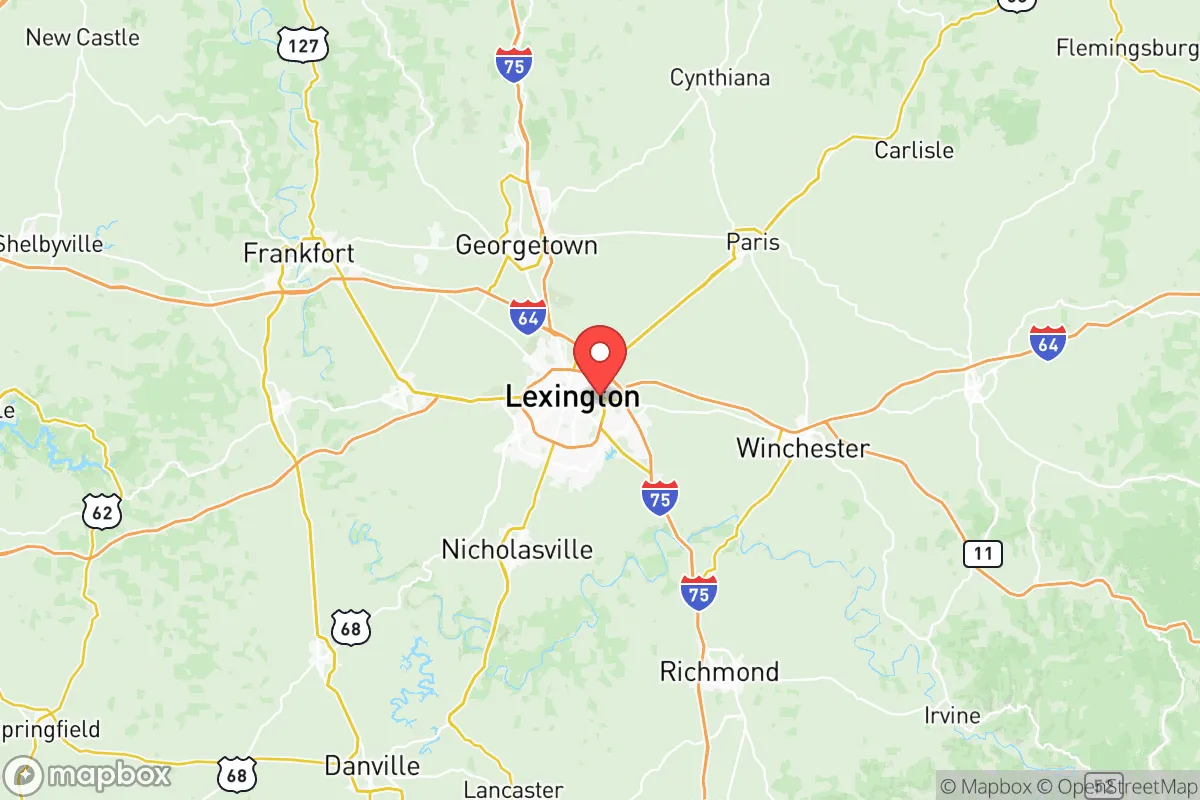
Demographics of Fayette County
Affluence Level in Fayette County
A middle-class area roughly in line with national averages across income, home values, education, and employment.
People of Fayette County
Fayette County, Kentucky, anchored by Lexington, is home to 321,122 residents who form the cultural and economic heart of the Bluegrass Region. The population is predominantly White (67.8%) with a significant Black minority (14.3%), a growing Hispanic community (9.2%), and smaller but established East/Southeast Asian (2.4%) and Indian subcontinent (1.8%) populations. The county is notably well-educated, with 47.3% of adults holding a college degree, and its identity remains deeply tied to horse breeding, bourbon, and a historically Southern character that is increasingly diversifying through immigration and domestic in-migration.
Settlement & growth (pre-1960)
Before European settlement, the region now known as Fayette County was part of the traditional hunting grounds of the Shawnee and Cherokee nations. The area was sparsely populated by Native peoples, who used the fertile limestone-rich land for seasonal hunting. The first permanent European settlers arrived in the 1770s, primarily Scots-Irish and English pioneers from Virginia and Pennsylvania, drawn by land grants offered to veterans of the Revolutionary War. These early settlers founded Lexington in 1775, naming it after the Battle of Lexington, Massachusetts. The town quickly became a hub for frontier agriculture, especially tobacco and hemp.
Through the early 1800s, Fayette County's population grew steadily as planters from the Upper South brought enslaved Black laborers to work the expanding hemp and thoroughbred horse farms. By 1860, enslaved people made up roughly one-third of the county's population. After the Civil War and Emancipation, many freed Black families remained in the county, forming communities in Lexington's near-east side and in rural hamlets like Meadowthorpe and Castlewood. The late 19th century saw a modest influx of German and Irish immigrants, who worked as brewers, distillers, and laborers in Lexington's growing bourbon and railroad industries. These groups settled primarily in Lexington's Northside and West End neighborhoods.
The early 20th century brought little new immigration to Fayette County, as restrictive national quotas limited arrivals. Instead, the county experienced domestic migration from rural Appalachia and the Deep South, with White and Black families moving to Lexington for manufacturing jobs at companies like the Trane Company and Square D. The post-World War II era saw suburban expansion, with new subdivisions like Ashland Park and Chevy Chase attracting middle-class White families. By 1960, Fayette County's population was roughly 85% White and 14% Black, with a tiny foreign-born share.
Modern era (post-1965)
The 1965 Hart-Cellar Act fundamentally reshaped Fayette County's demographics, though the changes came later and more gradually than in coastal cities. The first significant post-1965 immigrant group was East/Southeast Asian, primarily Vietnamese and Chinese, who began arriving in the 1970s and 1980s as refugees and professionals. These communities concentrated in Lexington's Southland Drive and Tates Creek corridors, where they established restaurants, grocery stores, and Buddhist temples. Today, East/Southeast Asians make up 2.4% of the county's population, with a visible presence in the Nicholasville Road commercial strip.
Indian subcontinent immigration accelerated in the 1990s and 2000s, driven by the University of Kentucky and the region's growing healthcare and technology sectors. Indian professionals, many from Gujarat and Andhra Pradesh, settled in Lexington's Hamburg area and the Beaumont neighborhood, where they formed a tight-knit community centered around the Hindu Temple of Kentucky in nearby Richmond. The Indian population now stands at 1.8% of the county, with many families owning businesses in the hotel and convenience-store sectors.
Hispanic growth has been the most dramatic post-1965 shift. Starting in the 1990s, Mexican and Central American immigrants arrived to work in tobacco and horse farm labor, construction, and the service industry. The Hispanic population grew from less than 1% in 1990 to 9.2% today. The largest concentration is in Lexington's Winchester Road and New Circle Road corridors, particularly in the Cardinal Valley neighborhood, which has become a vibrant Latino commercial district with taquerias, panaderias, and bodegas. A smaller but growing number of Hispanic families have moved to the suburban Brannon Crossing area.
Domestic migration has also reshaped the county. Since the 1990s, Fayette County has attracted White and Black professionals from the Rust Belt and the Northeast, drawn by the University of Kentucky, Toyota's Georgetown plant (just north of the county), and the region's lower cost of living. This in-migration has increased the college-educated share to 47.3%, one of the highest in Kentucky. The Black population, at 14.3%, remains concentrated in Lexington's East End and Winchester Road areas, though suburbanization has dispersed some families to Richmond Road and Man o' War Boulevard subdivisions.
The future
Fayette County's population is projected to continue growing, driven by both domestic in-migration and natural increase among Hispanic and immigrant communities. The county is not homogenizing; instead, it is tribalizing into distinct enclaves. The White population, while still the majority, is aging and declining as a share, while Hispanic and Asian communities are younger and growing. The Indian subcontinent population is likely to plateau as the tech and healthcare sectors mature, while East/Southeast Asian communities may see modest growth from refugee resettlement and family reunification. Hispanic growth is expected to continue, potentially reaching 12-15% of the county by 2040, as second-generation families expand and new arrivals come for construction and service jobs.
Cultural identity is shifting. The old Bluegrass aristocracy—old-money horse-farm families—still wields influence, but their demographic weight is shrinking. Newer arrivals, both domestic and foreign, are less tied to horse and bourbon traditions and more to the university, healthcare, and tech economies. This is creating a cultural divide between the historic core of Lexington and the newer suburban and exurban areas like Hamburg and Brannon Crossing, where immigrant and professional families mix. The county's political character, historically conservative, is becoming more moderate, especially in Lexington's urban core, while the rural edges remain solidly Republican.
For someone moving in now, Fayette County offers a mix of Southern tradition and growing diversity. The schools, particularly in the Fayette County Public Schools system, are increasingly diverse and have strong programs for English learners. The housing market remains relatively affordable compared to the national average, though prices have risen sharply since 2020. The county is becoming a more cosmopolitan, multi-ethnic place, but it retains a distinct Kentucky identity—one that is slowly absorbing new influences rather than being overwhelmed by them. The next decade will likely see continued suburban expansion, further integration of immigrant communities, and a gradual softening of the county's historically binary Black-White racial dynamic into a more complex, multi-hued mosaic.
* Values derived from national, state, county, city and local statistics and may differ in a specific area. Last updated: 2026-05-21T13:12:52.000Z
Narrative content on this page is AI-generated and may contain mistakes. Verify any details that matter before acting on them.
ReloMaps may earn a commission from affiliate links at no extra cost to you.