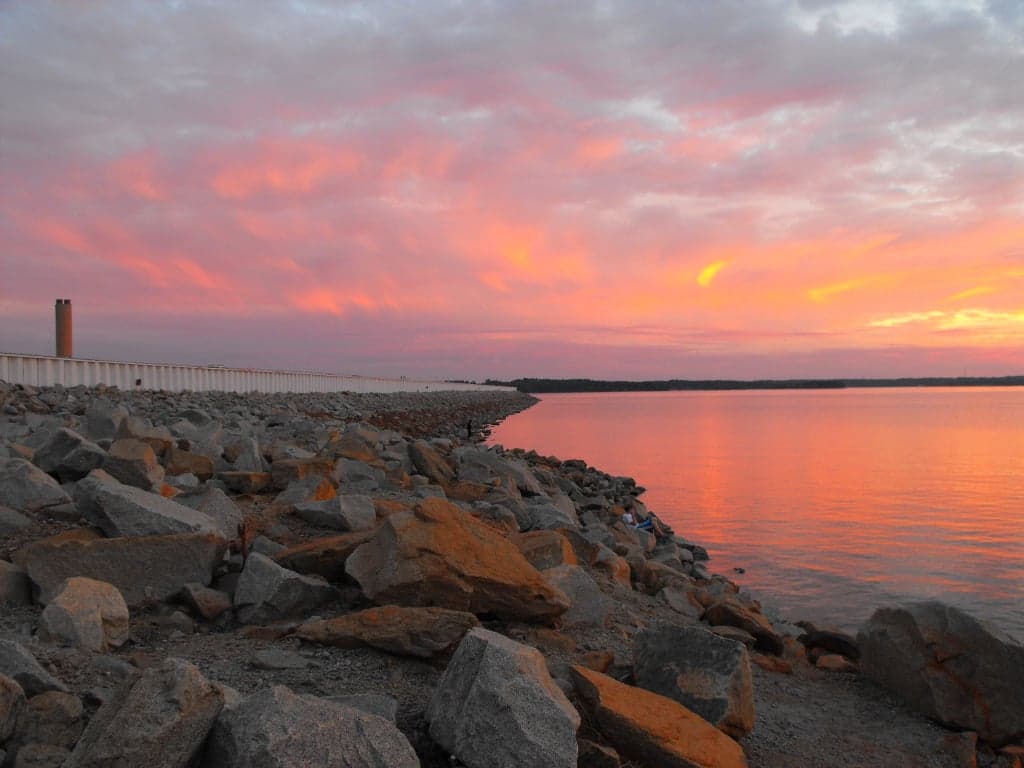
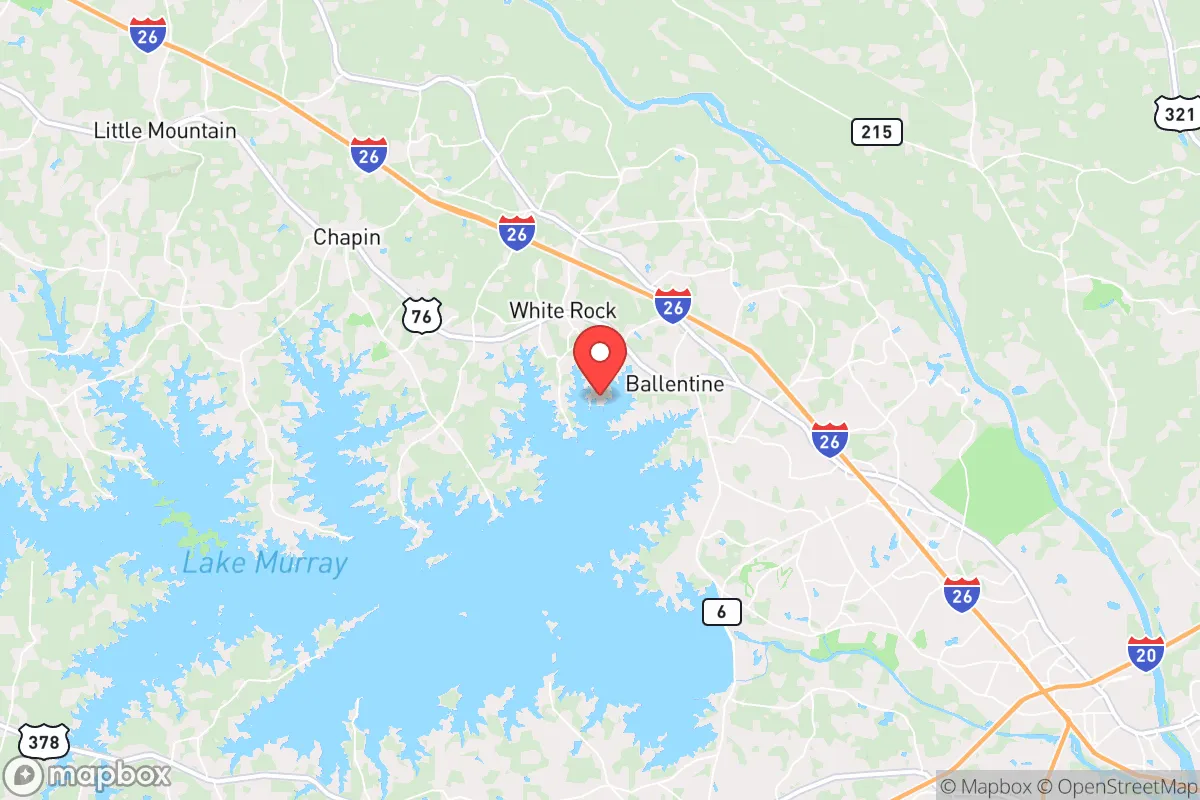
Quality of Life in Lake Murray of Richland, SC
A high quality of life with strong walkability, manageable living costs, healthy neighborhood signals, and solid amenity access.
What does Quality of Life tell us?
Quality of Life blends cost of living, nearby amenities, socioeconomic signals, and neighborhood character. City-level scores represent the whole municipality; individual neighborhoods can differ.
What does this tell us?
Quality of Life blends cost of living, nearby amenities, socioeconomic signals, and neighborhood character. City-level scores represent the whole municipality; individual neighborhoods can differ.
Cost of Living
41% above national average
The Real Cost of Living in Lake Murray of Richland, SC for 2026
| Tier | Individual | Family (4) |
|---|---|---|
| Survival | $27k | $50k |
| Comfortable | $74k | $108k |
| Luxury | $198k+ | $307k+ |
| Elite (Top 5%) | $233k+ | $361k+ |
109%
The Area Signal
A metric tracking the socioeconomic signals of the area.
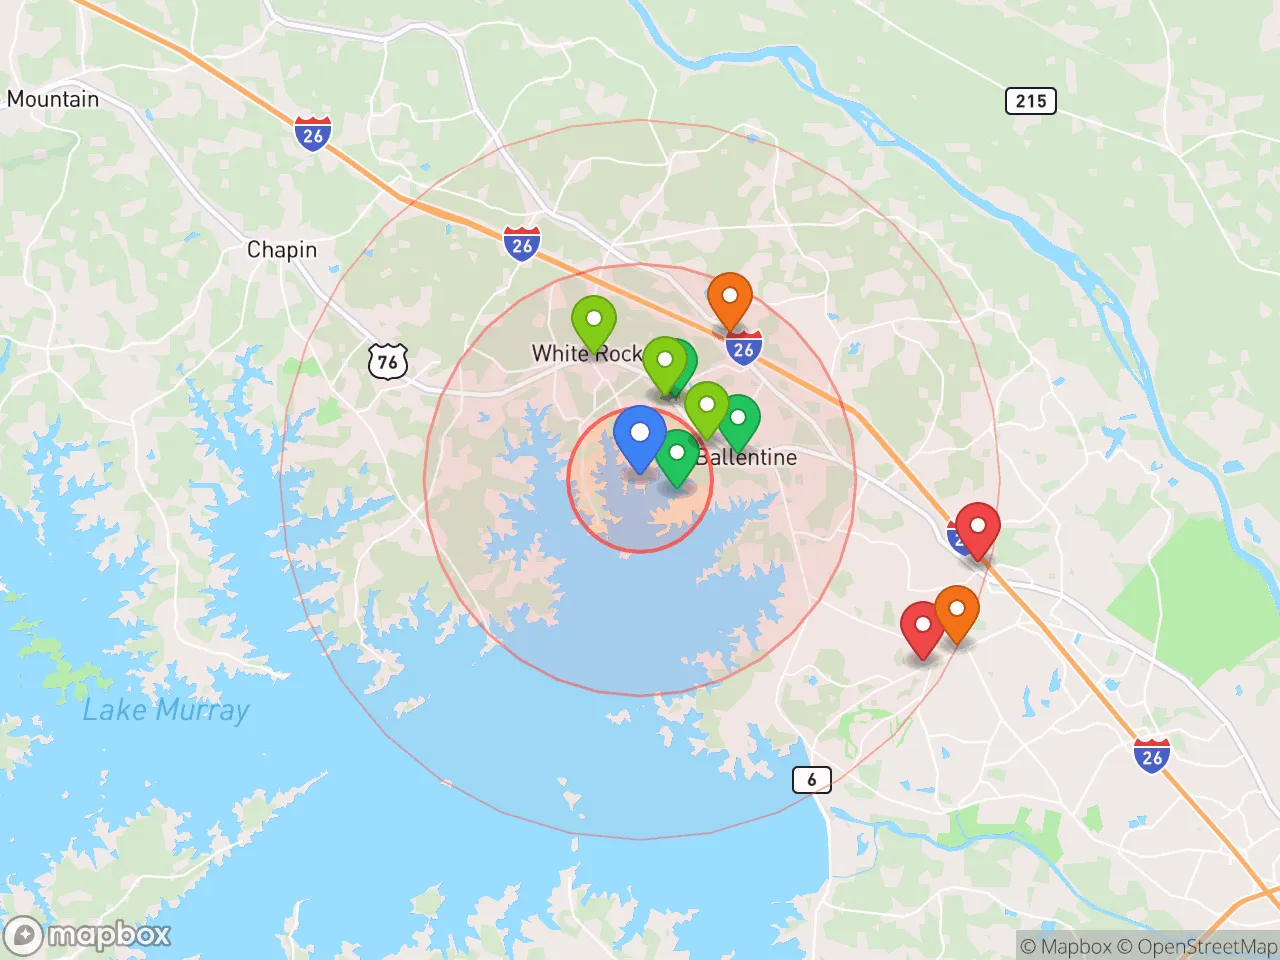
Hobbies
Explore the areaGroceries
5 within 10 miles
Gas
20 within 10 miles
Hospital
16 within 20 miles
Airport
CLT — Charlotte Douglas International
Post Office
USPS — Lake Murray of Richland, SC
Critical Amenities
Quality-of-Life Analysis
Lake Murray of Richland, South Carolina, is an affluent lakeside community where the cost of living index reaches 141—41 percent above the national average—reflecting a population of professionals, retirees, and second-home owners drawn to waterfront living near Columbia. The area’s median home value of $378,900 and median rent of $1,682 underscore its status as a premium residential enclave, with residents typically holding management, technical, or executive roles at regional employers such as BlueCross BlueShield of South Carolina, the University of South Carolina, and Fort Jackson. The average commute of roughly 26 minutes connects this suburban-rural hybrid to downtown Columbia’s job centers while preserving a distinctly quieter, nature-oriented daily life.
Cost of living and housing affordability compared to Columbia and Irmo
Lake Murray of Richland’s cost of living index of 141 is significantly higher than the U.S. baseline of 100 and notably above nearby Irmo (index ~105) and the Columbia metro area (index ~92). The median home value of $378,900 is roughly double the median for Richland County as a whole ($195,000 as of 2025), driven by premium lakefront lots and newer subdivisions like those in the 29063 zip code. Median rent of $1,682 is about 35 percent higher than the Columbia metro average of $1,250, reflecting limited rental inventory in this owner-dominated market. For buyers, property taxes remain relatively low—Richland County’s millage rate averages about 0.55 percent of assessed value—but homeowners insurance is elevated due to flood risk near the lake, adding $1,200–$2,000 annually to carrying costs. The area is not affordable for median-income households; a family earning the Richland County median of $68,000 would need to allocate roughly 45 percent of gross income to own the median-priced home here.
Schools, amenities, and the daily rhythm of lake-area living
Daily life in Lake Murray of Richland revolves around water access, outdoor recreation, and a slower pace than suburban Columbia. The area is served by Richland School District Two, which includes the highly rated Chapin High School (rated 9/10 on GreatSchools) and Lake Murray Elementary—both drawing families who prioritize school quality. Amenities center on the lake itself: public boat ramps at Dreher Island State Park and Lake Murray Dam, the 50-mile Saluda Shoals Park trail system, and seasonal events like the July 4th fireworks over the dam. Retail and dining are concentrated along Highway 6 in Irmo and Chapin, with grocery options limited to a single Publix and a Food Lion within the immediate lake area—residents often drive 15–20 minutes to Columbiana Centre for big-box shopping. The average commute of 25.6 minutes is manageable but can stretch to 35–40 minutes during peak hours on I-26 and SC-6, particularly for those working at Fort Jackson or downtown Columbia. Internet access is reliable through Spectrum and AT&T Fiber in most subdivisions, supporting remote work for the area’s many telecommuting professionals.
This community is best suited for upper-middle-income households—dual-income professionals earning above $120,000 annually, retirees with equity from prior homes, or remote workers who value lake access over urban density. Families should weigh the strong school ratings against the limited after-hours entertainment and higher housing costs. Those seeking walkable neighborhoods, nightlife, or affordable starter homes will find better options in Columbia’s Shandon or Forest Acres neighborhoods. Lake Murray of Richland delivers a high quality of life for those who prioritize water recreation, space, and low crime rates—the area’s violent crime rate is roughly 60 percent below the national average—but demands a financial and lifestyle commitment to car-dependent, nature-focused living.
Crime in Lake Murray of Richland, SC
Crime rates similar to the national median for U.S. locations.
Violent CrimeViolent Crime Analysis
Property CrimeProperty Crime Analysis
Crime Analysis
Lake Murray of Richland, South Carolina, presents a mixed safety profile. The area's violent crime rate of 370.4 per 100,000 residents is notably higher than the national average, while its property crime rate of 1,632.5 per 100,000 also exceeds the national benchmark. These figures place the community in a cautionary position for potential movers, particularly given its proximity to Columbia and the broader Richland County justice system.
Crime in context
When compared to state and national data, Lake Murray of Richland's violent crime rate is approximately 5% higher than the South Carolina state average and about 6% higher than the U.S. average. The property crime rate is similarly elevated, running roughly 15% above the national rate. These statistics are concerning because Richland County, like many large metro areas, has seen the influence of progressive prosecutorial policies. District attorneys and judges who prioritize leniency and rehabilitation over incarceration can result in more offenders remaining on the street, undermining public safety. This ideological approach, while sympathetic to criminals, directly impacts victims and the broader community by reducing deterrence and increasing recidivism risk.
What residents experience
For those living in Lake Murray of Richland, the elevated crime rates translate into tangible risks. Violent offenses—including assault, robbery, and aggravated incidents—occur at a frequency that demands vigilance. Property crimes such as burglary, theft, and vehicle break-ins are the most common threats, often targeting homes and vehicles left unsecured. Residents report that theft from vehicles and package theft are persistent annoyances, particularly in neighborhoods near major roads or with easy access from Columbia. The area's appeal as a lakefront community can also attract transient criminals who view vacation homes and boat storage as easy targets. While many neighborhoods feel safe during daylight hours, the data suggests that evening and overnight hours carry elevated risk, especially in areas with less street lighting or lower density.
Neighborhood-level variation
Safety conditions are not uniform across Lake Murray of Richland. Gated communities and waterfront developments with private security typically report far lower incident rates than the area average, sometimes approaching national norms. In contrast, neighborhoods closer to Interstate 26 or the urban fringe of Columbia experience higher crime densities, as they are more accessible to offenders from the metro area. Lexington County portions of the lake often have slightly lower crime rates than Richland County sections, reflecting different law enforcement priorities and prosecutorial philosophies. Prospective residents should examine block-level crime maps and consult with local sheriff's offices, as the difference between a safe street and a high-risk block can be stark within this otherwise scenic region.
* Values derived from national, state, county, city and local statistics and may differ in a specific area. Last updated: 2026-04-23T04:03:33.000Z
Narrative content on this page is AI-generated and may contain mistakes. Verify any details that matter before acting on them.
ReloMaps may earn a commission from affiliate links at no extra cost to you.