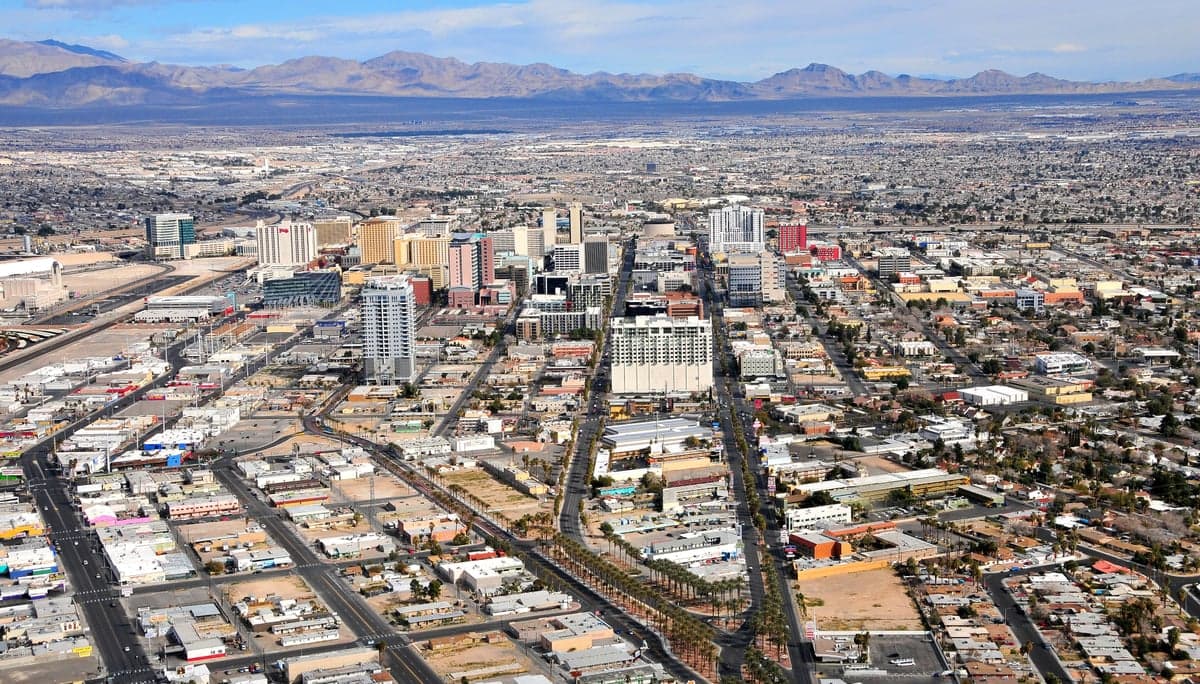
Photo: Wikipedia
Demographics of Las Vegas, NV
Affluence Level in Las Vegas, NV
A middle-class area roughly in line with national averages across income, home values, education, and employment.
People of Las Vegas, NV
The people of Las Vegas, Nevada today form a rapidly diversifying, transient, and service-oriented population of 650,873, defined by a majority-minority character where no single ethnic group holds a numerical majority. The city is younger than the national median, less college-educated at 27.3%, and heavily reliant on the hospitality and entertainment economy. Its distinctive identity is one of constant churn — a place where newcomers arrive for jobs, stay for a few years, and often move on, creating a population that is both deeply American in its immigrant roots and uniquely tied to the fortunes of a single industry.
How the city was settled and grew
Las Vegas was founded in 1905 as a railroad town, a watering stop on the Union Pacific line between Salt Lake City and Los Angeles. The original population was a mix of Anglo railroad workers, Mormon settlers from Utah, and a small number of Chinese laborers who had helped build the transcontinental railroad. These early residents clustered near the original downtown, in what is now the Historic Westside — a neighborhood that became the city's first multiethnic enclave, housing Black porters, Mexican laborers, and European immigrants alike. The 1931 legalization of gambling and the construction of Hoover Dam (1931-1936) triggered the first major population boom, drawing thousands of white and Hispanic construction workers. By 1940, the city had grown to 8,422, with a population that was overwhelmingly white (over 90%) and native-born. The post-World War II era saw a second wave: returning servicemen, many from nearby Nellis Air Force Base, settled in the Paradise area (an unincorporated township south of the Strip), while the nascent casino industry recruited Italian-American and Jewish-American managers from the East Coast, who established enclaves in Huntridge and John S. Park.
Modern era (post-1965)
The 1965 Immigration and Nationality Act reshaped Las Vegas profoundly. The city's foreign-born population now stands at 10.6%, a figure that understates the impact of second-generation growth. The largest post-1965 wave has been Hispanic, primarily Mexican and Central American, drawn by construction and service jobs during the mega-resort boom of the 1990s and 2000s. Today, Hispanics make up 34.1% of the population, concentrated in the East Las Vegas neighborhoods east of I-15 and in the Charleston Heights area, where Spanish-language businesses and Catholic parishes anchor the community. The Black population, at 11.5%, is largely descended from the Great Migration of the 1940s-1970s, when the Historic Westside became a segregated but self-sufficient hub. Since the 1990s, middle-class Black families have suburbanized into North Las Vegas and the Green Valley area of Henderson. East and Southeast Asian communities (6.3%) — primarily Filipino, Vietnamese, and Chinese — arrived in two waves: professionals in the 1980s and service workers in the 2000s, settling in Spring Valley and the Chinatown corridor along Spring Mountain Road. The Indian-subcontinent population (0.4%) is small but growing, concentrated in tech and hospitality management roles, with no single dominant neighborhood. White non-Hispanic residents, now 40.8%, have become the most suburbanized group, with strongholds in Summerlin (west) and Henderson (southeast), though they remain the plurality in the city proper.
The future
The population of Las Vegas is heading toward a continued diversification that is more about ethnic succession than integration. Hispanic growth is the strongest demographic driver, projected to approach 40% of the city's population by 2035, driven by both immigration and higher birth rates. The white non-Hispanic share is declining steadily, falling below 40% in the 2020 census and likely to drop further. East and Southeast Asian communities are plateauing, with Filipino and Vietnamese populations stabilizing as second-generation members assimilate and move to suburbs. The Indian-subcontinent community, while small, is growing from a low base, driven by H-1B visa holders in the expanding tech sector. The city is not homogenizing; rather, it is tribalizing into distinct enclaves — Hispanic East Las Vegas, Asian Spring Mountain Road, white Summerlin, Black North Las Vegas — with limited cross-neighborhood mixing. The transient nature of the population (roughly 40% of residents have lived in the city for fewer than five years) means these enclaves are porous but persistent. For a newcomer, this means that where you choose to live will largely determine the ethnic and cultural character of your daily life.
Las Vegas is becoming a majority-minority city where no single group dominates, but where ethnic enclaves remain strong. For a conservative-leaning individual or family, this means a city that is culturally diverse but socially segmented — you can find a neighborhood that matches your preferences, but the city as a whole is young, transient, and service-driven. The population is growing (projected to reach 700,000 by 2030), but the growth is overwhelmingly Hispanic and working-class, with a smaller influx of Asian professionals. The city's future is one of increasing diversity, lower educational attainment, and continued economic dependence on tourism — a combination that offers opportunity for those in the service sector but may challenge those seeking a stable, long-term community.
* Values derived from national, state, county, city and local statistics and may differ in a specific area. Last updated: 2026-04-15T23:42:23.000Z
Narrative content on this page is AI-generated and may contain mistakes. Verify any details that matter before acting on them.
ReloMaps may earn a commission from affiliate links at no extra cost to you.