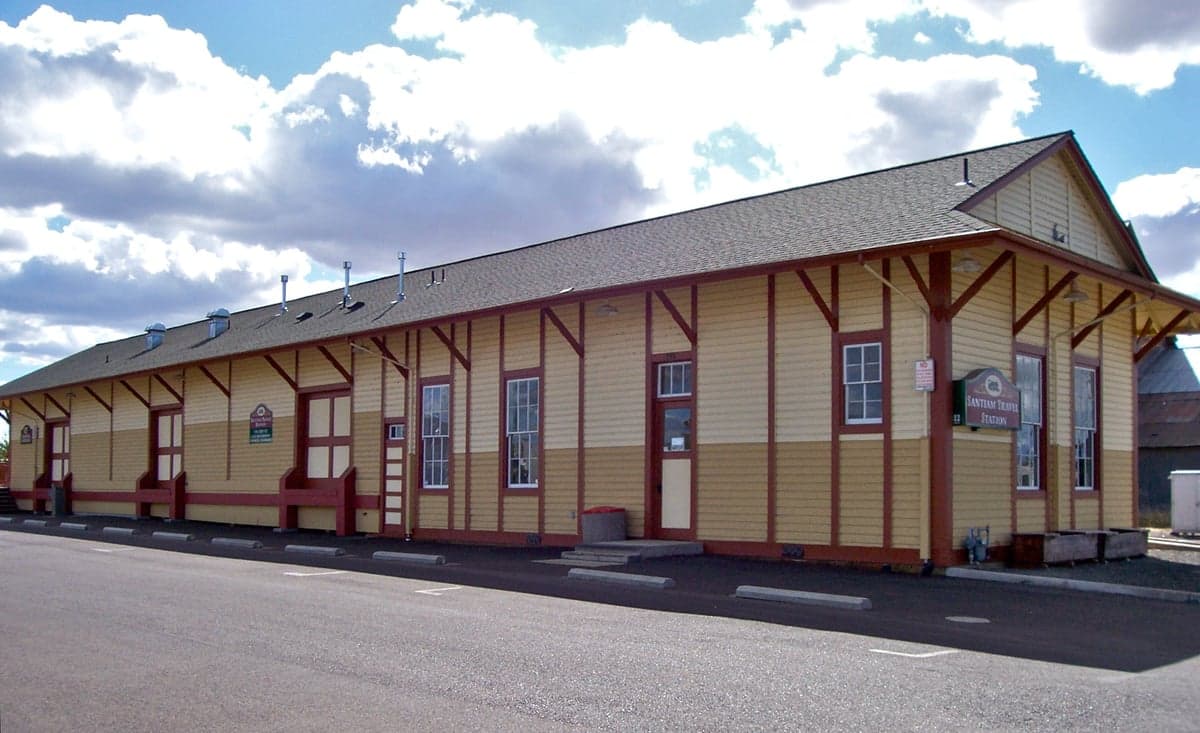
Photo: Wikipedia
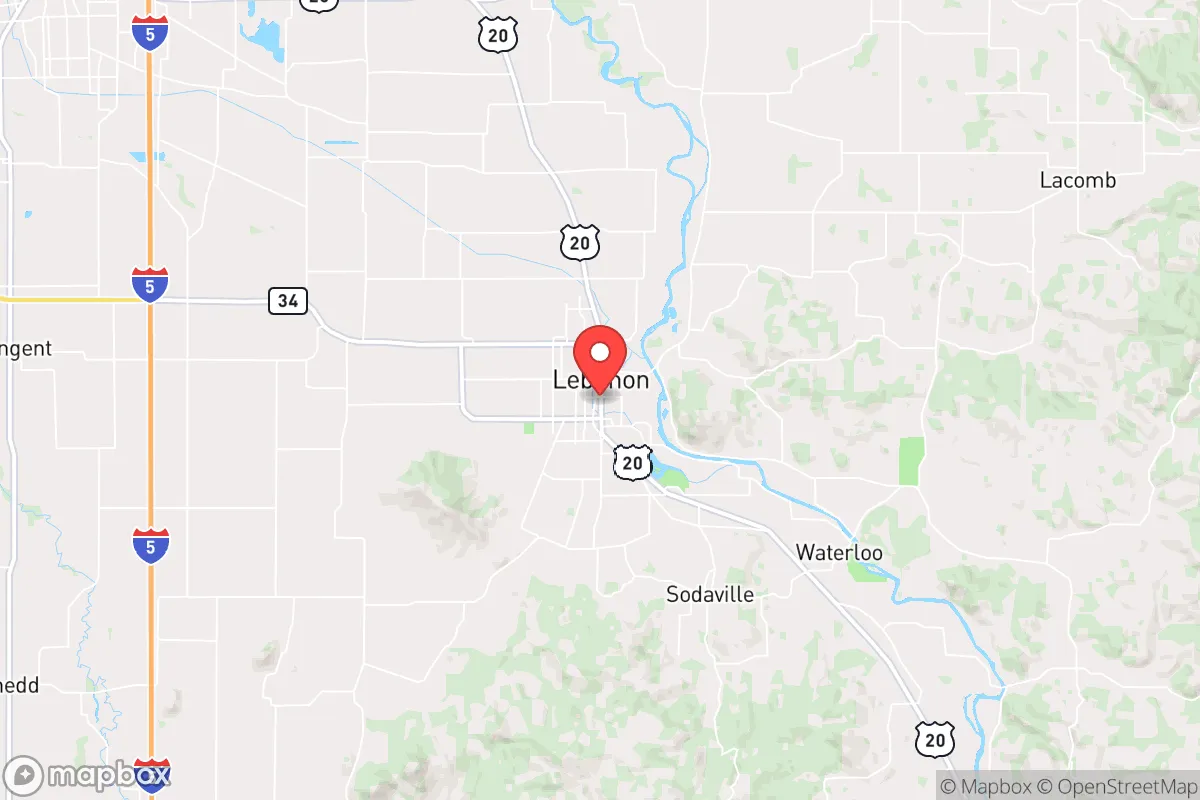
Quality of Life in Lebanon, OR
A high quality of life with strong walkability, manageable living costs, healthy neighborhood signals, and solid amenity access.
What does Quality of Life tell us?
Quality of Life blends cost of living, nearby amenities, socioeconomic signals, and neighborhood character. City-level scores represent the whole municipality; individual neighborhoods can differ.
What does this tell us?
Quality of Life blends cost of living, nearby amenities, socioeconomic signals, and neighborhood character. City-level scores represent the whole municipality; individual neighborhoods can differ.
Cost of Living
8% above national average
The Real Cost of Living in Lebanon, OR for 2026
| Tier | Individual | Family (4) |
|---|---|---|
| Survival | $20k | $38k |
| Comfortable | $57k | $85k |
| Luxury | $95k+ | $147k+ |
| Elite (Top 5%) | $111k+ | $172k+ |
67%
The Area Signal
A metric tracking the socioeconomic signals of the area.
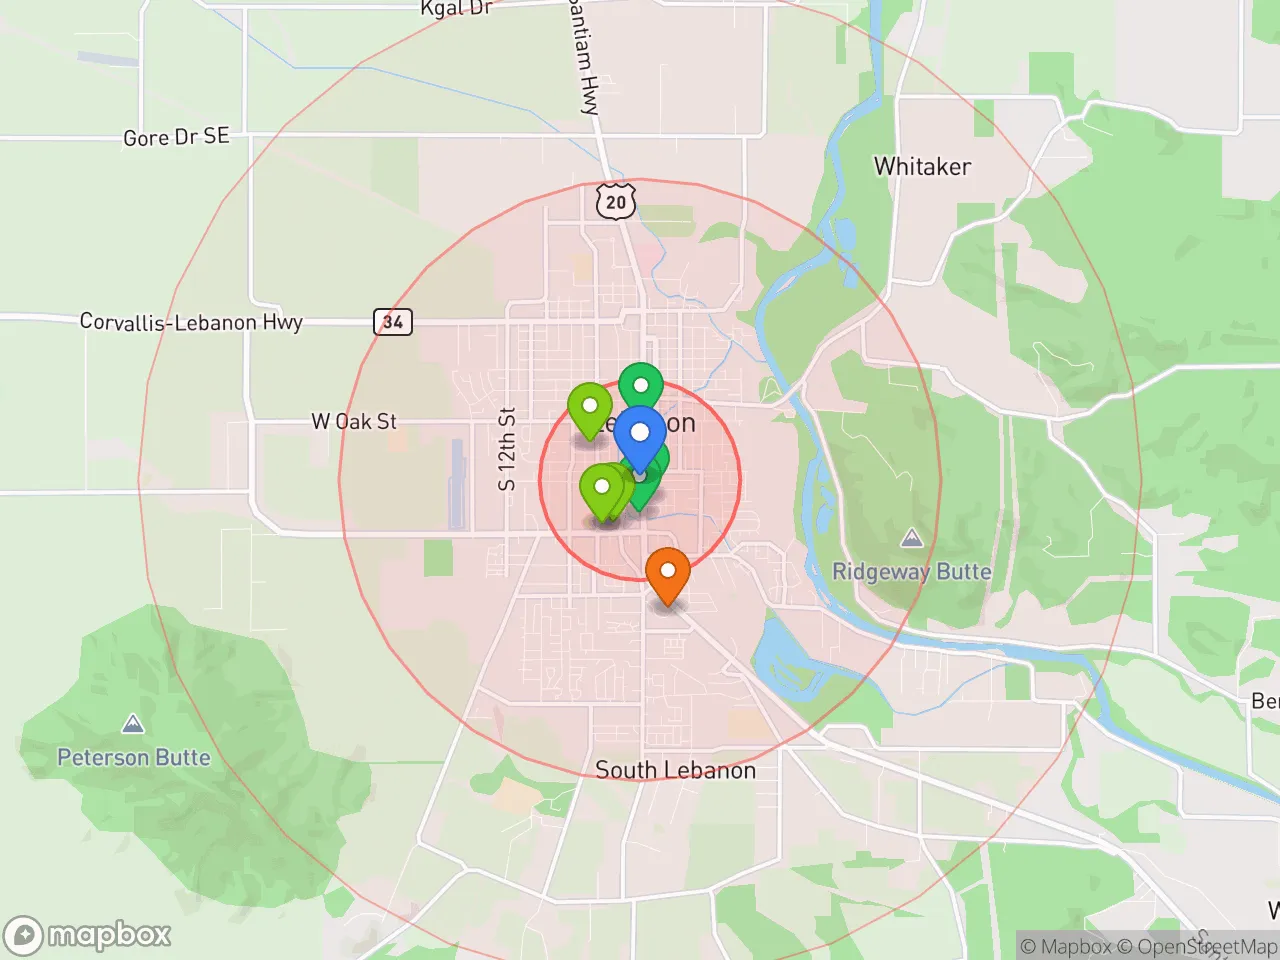
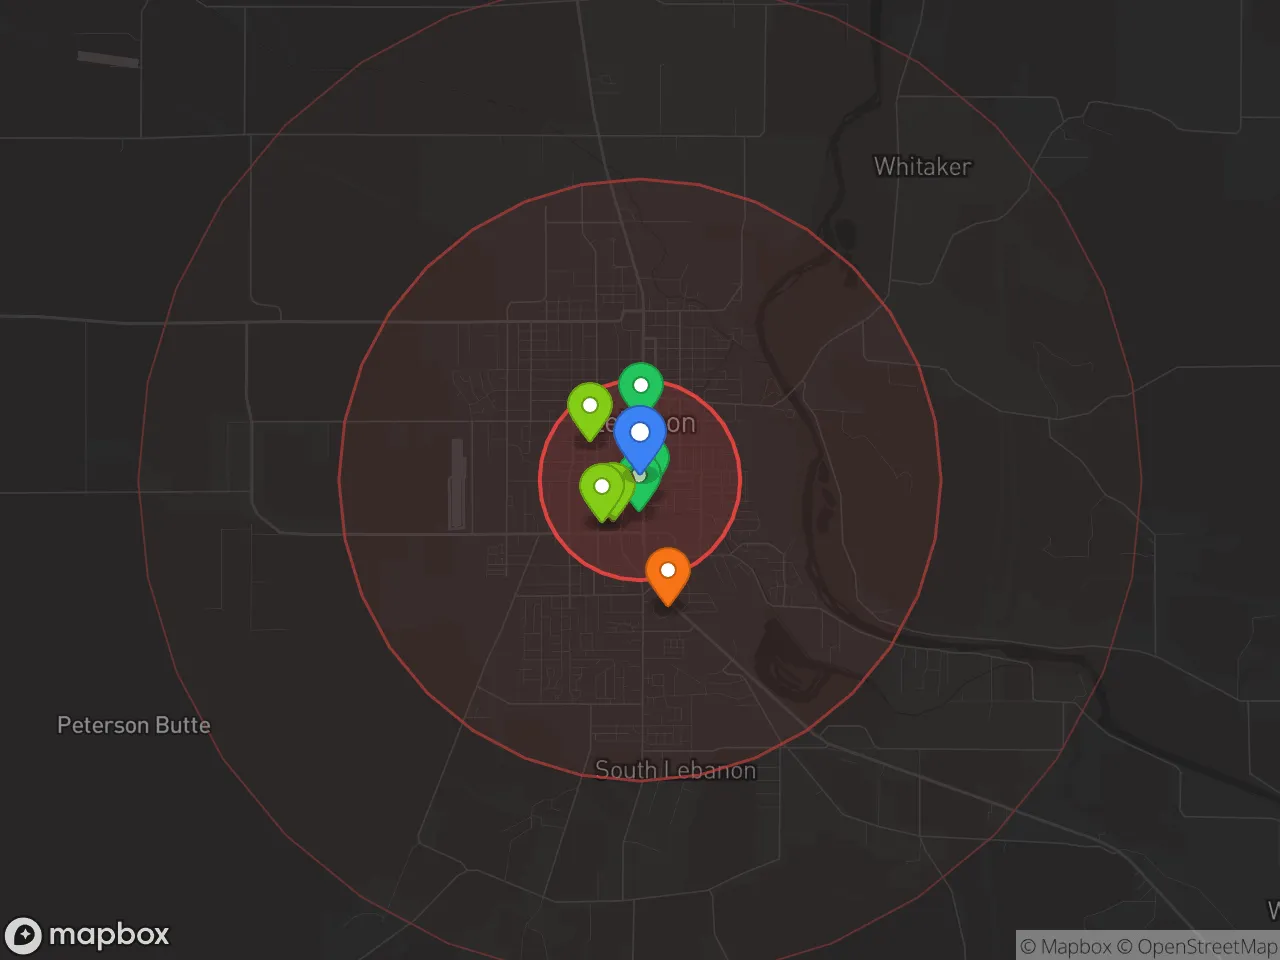
Hobbies
Explore the areaGroceries
3 within 10 miles
Gas
12 within 10 miles
Hospital
4 within 20 miles
Airport
PDX — Portland International
Post Office
USPS — Lebanon, OR
Critical Amenities
Quality-of-Life Analysis
Lebanon, Oregon, presents a quality of life defined by modest affluence and a strong sense of community, attracting a mix of families, retirees, and workers in the trades and healthcare sectors. With a cost of living index of 108 (slightly above the U.S. average of 100), the city offers a more attainable lifestyle than the Portland metro area while maintaining access to the Willamette Valley’s agricultural and outdoor amenities. The population skews toward middle-income households, with a notable presence of long-term residents and newcomers drawn by the area’s slower pace and proximity to both the Cascade Range and the Oregon coast.
Cost of living, housing affordability, and how Lebanon compares to nearby cities
Lebanon’s housing market is a key draw for those priced out of Corvallis and Albany. The median home value sits at $295,900, roughly 30% lower than Corvallis’s median of $425,000 and about 15% below Albany’s $350,000. Renters also find relative value, with a median rent of $1,274—well under the $1,500+ averages in Corvallis and Salem. However, the cost of living index of 108 means everyday expenses like groceries and utilities run slightly above the national norm, driven by Oregon’s state income tax and regional food prices. The average commute of 26.4 minutes reflects the reality that many residents work outside Lebanon—commonly in Albany (15 minutes), Corvallis (20 minutes), or Salem (30 minutes)—trading lower housing costs for longer drive times. For first-time buyers or those seeking a single-family home under $300,000, Lebanon remains one of the more accessible options in Linn County.
Schools, daily amenities, and the rhythm of life in Lebanon
Daily life in Lebanon centers on a compact downtown with local eateries, a historic theater, and the Santiam River running through town. The Lebanon Community School District serves roughly 4,000 students, with Lebanon High School offering career-technical programs in health sciences and manufacturing that align with local employment. For groceries and errands, residents rely on a mix of national chains (Walmart, Fred Meyer) and local markets, while major retail and medical services require a short drive to Albany or Corvallis. The city’s parks system includes the 40-acre River Park and the nearby Cascades Gateway Trail, supporting a lifestyle that blends small-town convenience with outdoor recreation. Cultural amenities are limited—no major museums or concert venues—but the community calendar is filled with events like the annual Strawberry Festival and the Lebanon Farmers Market, which run from May through October. The overall rhythm is slower than the Willamette Valley’s larger cities, appealing to those who prioritize space, quiet, and a tight-knit social fabric over urban nightlife.
Lebanon is best suited for families seeking an affordable home base within commuting distance of mid-valley jobs, retirees who value a lower cost of living and access to nature, and tradespeople or healthcare workers employed at Samaritan Lebanon Community Hospital or nearby manufacturing plants. It is less ideal for young professionals seeking walkable urban amenities or high-end dining, as the city’s social and cultural offerings remain modest. For those who can tolerate a 25-minute commute and prefer a slower, community-oriented lifestyle, Lebanon offers a solid quality of life at a price point that is increasingly rare in western Oregon.
Crime in Lebanon, OR
Lower crime rates than 85% of comparable U.S. locations.
Violent CrimeViolent Crime Analysis
Property CrimeProperty Crime Analysis
Crime Analysis
Lebanon, Oregon, reports a violent crime rate of 157.5 incidents per 100,000 residents and a property crime rate of 684.1 per 100,000. These figures place the city in a moderate safety tier compared to national averages, but the broader context of Linn County and Oregon’s progressive criminal justice policies introduces significant concerns for prospective residents. The city’s proximity to the liberal-leaning Willamette Valley metro area, combined with district attorneys and judges who often prioritize rehabilitation over incarceration, creates conditions where property crime rates remain elevated and recidivism is a persistent issue.
Crime in context
Lebanon’s violent crime rate of 157.5 per 100,000 is roughly 55% lower than the national average of about 380 per 100,000, a figure that may initially appear reassuring. However, its property crime rate of 684.1 per 100,000 is approximately 30% higher than the national average of 527 per 100,000. This disparity is typical of smaller cities near large metro areas like Portland and Salem, where progressive justice reforms—such as Measure 110 (drug decriminalization) and soft-on-recidivism sentencing guidelines—have been linked to increased theft, burglary, and vehicle break-ins. Oregon’s statewide property crime rate consistently ranks among the highest in the nation, and Lebanon reflects that trend. The city’s violent crime is concentrated in specific incidents (assaults, robberies) rather than widespread, but the property crime volume directly impacts daily life for residents.
What residents experience
For those living in Lebanon, the most tangible safety concern is property crime. Residents report frequent incidents of package theft, unlocked vehicle entry, and shed or garage burglaries, particularly in neighborhoods near Highway 20 and the downtown core. The Linn County District Attorney’s office, operating under Oregon’s progressive bail reform laws, often releases non-violent property offenders on citation or low bail, leading to a cycle of repeat offenses. This creates a sense of futility for victims, as stolen items are rarely recovered and prosecution is inconsistent. Violent crime is less common but not absent—domestic violence and alcohol-fueled assaults near bars along Main Street are the most reported categories. The Lebanon Police Department maintains a visible presence, but staffing levels are stretched thin, and response times for non-emergency property crimes can exceed 24 hours.
Neighborhood-level variation
Safety in Lebanon varies noticeably by area. The southwest neighborhoods near Cheadle Lake Park and the hospital are generally considered the safest, with lower crime density and more active neighborhood watch programs. In contrast, the northwest quadrant along Park Street and the area around the former Lebanon High School see higher rates of property crime and occasional drug-related disturbances. The downtown commercial corridor, while undergoing revitalization, experiences the most frequent theft and vandalism. Prospective renters and buyers should prioritize properties with off-street parking, security lighting, and proximity to the police substation on South 5th Street. Overall, Lebanon is not a high-violence city, but its property crime problem—exacerbated by Oregon’s lenient justice system—demands proactive security measures from residents.
* Values derived from national, state, county, city and local statistics and may differ in a specific area. Last updated: 2026-05-05T08:08:35.000Z
Narrative content on this page is AI-generated and may contain mistakes. Verify any details that matter before acting on them.
ReloMaps may earn a commission from affiliate links at no extra cost to you.