
Photo: Wikipedia
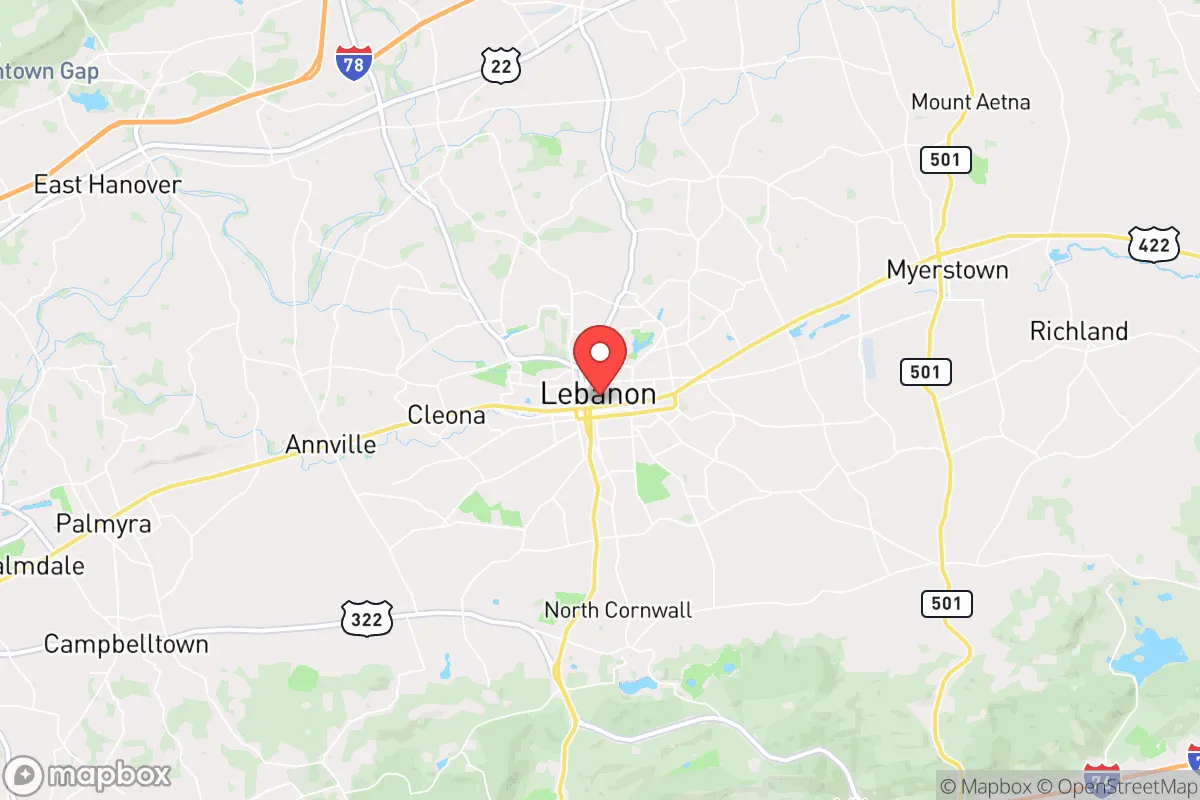
Demographics of Lebanon, PA
Affluence Level in Lebanon, PA
A low-income area with significant economic hardship. Household wealth and educational attainment are well below national averages.
People of Lebanon, PA
The people of Lebanon, Pennsylvania, today form a densely packed, working-class city of roughly 26,600 residents, marked by a near-even split between a long-established white population (48.0%) and a rapidly growing Hispanic community (45.3%). The city is one of the most ethnically balanced small cities in the state, with a foreign-born share of just 3.9%—indicating that most of the Hispanic growth comes from U.S.-born families rather than recent immigration. With only 14.7% of adults holding a bachelor’s degree, Lebanon remains a blue-collar, family-oriented city where manufacturing and logistics anchor daily life, and where distinct neighborhoods still echo the waves of settlement that built them.
How the city was settled and grew
Lebanon was laid out in 1721 on land granted to German-speaking settlers from the Palatinate region, who were drawn by the fertile soil of the Lebanon Valley and religious tolerance under William Penn’s proprietorship. These original Pennsylvania Dutch families—Lutherans, Reformed, and Mennonites—established the city’s core around what is now Cumberland Street and North 7th Street, building stone farmhouses and churches that still stand in the Historic District. By the mid-19th century, the arrival of the Cornwall Railroad and the discovery of iron ore turned Lebanon into an industrial hub. The Coleman family built the Lebanon Iron Company, and later the Bethlehem Steel plant, drawing waves of Irish and Italian immigrants between 1880 and 1920. These groups settled in the Northside neighborhood, near the rail yards and foundries, creating tight-knit Catholic parishes and social clubs that persisted for generations. A smaller wave of Eastern European Jews arrived around 1900, establishing a commercial corridor along 8th Street that remained active through the 1950s.
Modern era (post-1965)
The 1965 Hart-Cellar Act opened immigration from Latin America, but Lebanon’s Hispanic population did not begin to grow substantially until the 1980s, when Puerto Rican families—who are U.S. citizens—moved from New York City and Philadelphia for manufacturing jobs at the Bayer Corporation and Alcoa plants. By the 2000s, the Hispanic share had risen to roughly 30%, concentrated in the Southside neighborhood, south of the railroad tracks and west of 5th Street. This area now hosts bodegas, Pentecostal churches, and bilingual signage, and is the city’s most densely populated quadrant. Meanwhile, the white population, which was over 90% as late as 1970, declined through suburban flight to nearby townships like North Lebanon and South Lebanon, leaving an aging, lower-income cohort in the Historic District and Northside. The Black population (2.9%) and East/Southeast Asian population (0.5%) remain small and dispersed, with no single ethnic enclave. Indian-subcontinent residents (0.4%) are a tiny, professional cohort, often employed in healthcare at the Lebanon VA Medical Center.
The future
Lebanon’s demographic trajectory points toward continued Hispanic growth and white decline, but at a slowing pace. The Hispanic share has plateaued near 45% since 2020, as the city’s housing stock—mostly older rowhomes and duplexes—reaches capacity and younger families move to cheaper outlying towns like Jonestown or Myerstown. The white population, now below 50%, is aging in place, with few young white families moving in. The city is not tribalizing into hostile enclaves; rather, the Southside is becoming more uniformly Hispanic, while the Northside and Historic District remain mixed but increasingly white and older. New immigrant arrivals are negligible—the 3.9% foreign-born share is below the national average—so future growth will come from natural increase among Hispanic families, who have a higher birth rate. Over the next 10-20 years, Lebanon will likely become a majority-Hispanic city, with a white minority concentrated in the historic core and a small, stable Black and Asian presence.
For a conservative-leaning individual or family moving in now, Lebanon offers a low-cost, walkable city where traditional neighborhood identities still matter, but where the cultural and political center of gravity is shifting toward a younger, more Hispanic population. The city is not a melting pot but a place of parallel communities, with the Southside increasingly dominant in local elections and school enrollments. Those who value stability and familiarity may prefer the older white neighborhoods; those open to a bilingual, working-class environment will find Lebanon affordable and authentic, if economically modest.
* Values derived from national, state, county, city and local statistics and may differ in a specific area. Last updated: 2026-05-01T09:23:47.000Z
Narrative content on this page is AI-generated and may contain mistakes. Verify any details that matter before acting on them.
ReloMaps may earn a commission from affiliate links at no extra cost to you.