
Photo: Wikipedia
Quality of Life in Lebanon, PA
A high quality of life with strong walkability, manageable living costs, healthy neighborhood signals, and solid amenity access.
What does Quality of Life tell us?
Quality of Life blends cost of living, nearby amenities, socioeconomic signals, and neighborhood character. City-level scores represent the whole municipality; individual neighborhoods can differ.
What does this tell us?
Quality of Life blends cost of living, nearby amenities, socioeconomic signals, and neighborhood character. City-level scores represent the whole municipality; individual neighborhoods can differ.
Cost of Living
27% below national average
The Real Cost of Living in Lebanon, PA for 2026
| Tier | Individual | Family (4) |
|---|---|---|
| Survival | $16k | $31k |
| Comfortable | $28k | $41k |
| Luxury | $78k+ | $120k+ |
| Elite (Top 5%) | $91k+ | $142k+ |
116%
The Area Signal
A metric tracking the socioeconomic signals of the area.

Hobbies
Explore the areaGroceries
6 within 10 miles
Gas
20 within 10 miles
Hospital
12 within 20 miles
Airport
PHL — Philadelphia International
Post Office
USPS — Lebanon, PA
Critical Amenities
Quality-of-Life Analysis
Lebanon, Pennsylvania, offers a notably affordable quality of life, with a cost of living index of 73 (27% below the U.S. average) that attracts a mix of young families, tradespeople, and retirees seeking economic breathing room. The city’s median home value sits at $143,200, and the median rent is $1,024, figures that undercut nearby Harrisburg (where the median home value exceeds $200,000) and Lancaster (where rents average closer to $1,300). The population skews working-class and family-oriented, with a strong presence of manufacturing and healthcare employees who value short commutes and stable neighborhoods over urban nightlife.
Cost of living, housing costs, and how they compare to nearby areas
Lebanon’s housing market is one of the most accessible in south-central Pennsylvania. The median home value of $143,200 is roughly 40% lower than the national median and about 35% lower than in Lancaster County. Renters also benefit: the median rent of $1,024 is nearly $300 less than the Lancaster average and undercuts Harrisburg by about $200. The average commute of 20 minutes is well below the national average of 26 minutes, meaning residents save both time and transportation costs. Property taxes in Lebanon County are moderate—around 2.3% of assessed value—though buyers should note that Pennsylvania’s lack of a homestead exemption means full millage applies. For comparison, a similar home in Hershey (10 miles east) would cost roughly $280,000, making Lebanon a clear value play for buyers willing to trade proximity to tourist amenities for lower monthly payments.
What daily life is like for families: schools, amenities, and local rhythm
Daily life in Lebanon revolves around a compact downtown with a walkable core, a historic farmers market (Lebanon Farmers Market, open Saturdays), and a handful of family-run diners and bakeries. The Lebanon School District serves about 4,500 students, with an average student-teacher ratio of 15:1 and a graduation rate near 87%—slightly below the state average of 89%, but improving. For recreation, residents use the 40-acre Coleman Memorial Park (with a pool, trails, and sports fields) or drive 15 minutes to the Swatara State Park for hiking and fishing. The city lacks a major hospital within its limits—WellSpan Good Samaritan Hospital is the primary facility, located just north of downtown—but urgent care and specialist clinics are scattered throughout the county. Retail is concentrated along the Route 422 corridor, anchored by the Lebanon Valley Mall and big-box stores. The cultural scene is modest: the Lebanon Community Theatre and the Lebanon County Historical Society provide low-key weekend options, while nightlife is limited to a few bars and a microbrewery (Lebanon Valley Brewing Company).
This environment suits residents who prioritize financial stability and short commutes over cultural density. Young families can buy a three-bedroom home for under $150,000 and reach jobs in Hershey, Harrisburg, or Reading within 30 minutes. Retirees on fixed incomes find the low cost of living and quiet streets appealing, though those seeking walkable urban amenities or top-tier school districts may prefer Lititz or Hershey. Tradespeople and manufacturing workers—Lebanon’s largest employment sector—benefit from the proximity to industrial employers like the Lebanon VA Medical Center and local food-processing plants. The trade-off is clear: Lebanon offers a slower, more affordable pace of life than its pricier neighbors, but with fewer entertainment options and a school system that still trails the state average. For budget-conscious families and professionals who value a 20-minute commute and a mortgage under $1,000, it remains one of the most practical choices in the region.
Crime in Lebanon, PA
Generally safer than 58% of comparable U.S. locations.
Violent CrimeViolent Crime Analysis
Property CrimeProperty Crime Analysis
Crime Analysis
Lebanon, Pennsylvania, presents a mixed safety profile that requires careful consideration for potential movers. The city’s violent crime rate of 174.4 incidents per 100,000 residents is notably lower than the national average, but its property crime rate of 1,167.8 per 100,000 significantly exceeds both state and national benchmarks, indicating a higher risk of theft and burglary. As a small city within commuting distance of the larger, more progressive Harrisburg metropolitan area, Lebanon’s local justice system and policing strategies are critical factors in understanding its overall safety.
Crime in context
Lebanon’s violent crime rate is roughly half the national average, making serious offenses like homicide and aggravated assault less common here than in many comparably sized cities. However, the property crime rate is a clear concern, sitting well above the Pennsylvania state average and the national figure. This disparity suggests that while residents are less likely to face personal violence, they face a heightened risk of having their homes, vehicles, or belongings stolen. The city’s proximity to the larger, more liberal-leaning Harrisburg metro area is a relevant factor; progressive prosecutorial policies in nearby jurisdictions can sometimes lead to reduced penalties for property offenses, potentially contributing to a cycle of recidivism that spills into smaller communities like Lebanon.
What residents experience
Daily life in Lebanon involves a heightened awareness of property security. Residents commonly report car break-ins, package theft, and occasional home burglaries, particularly in areas with older housing stock and less street lighting. The city’s police department is active, but the high property crime rate suggests that enforcement alone may not be sufficient. The influence of progressive judicial philosophies in the broader region—where district attorneys may prioritize diversion programs over incarceration for repeat property offenders—can undermine deterrence. This approach, while intended to reduce jail populations, often results in more criminals remaining on the street, directly impacting the sense of security for law-abiding residents and victims of crime.
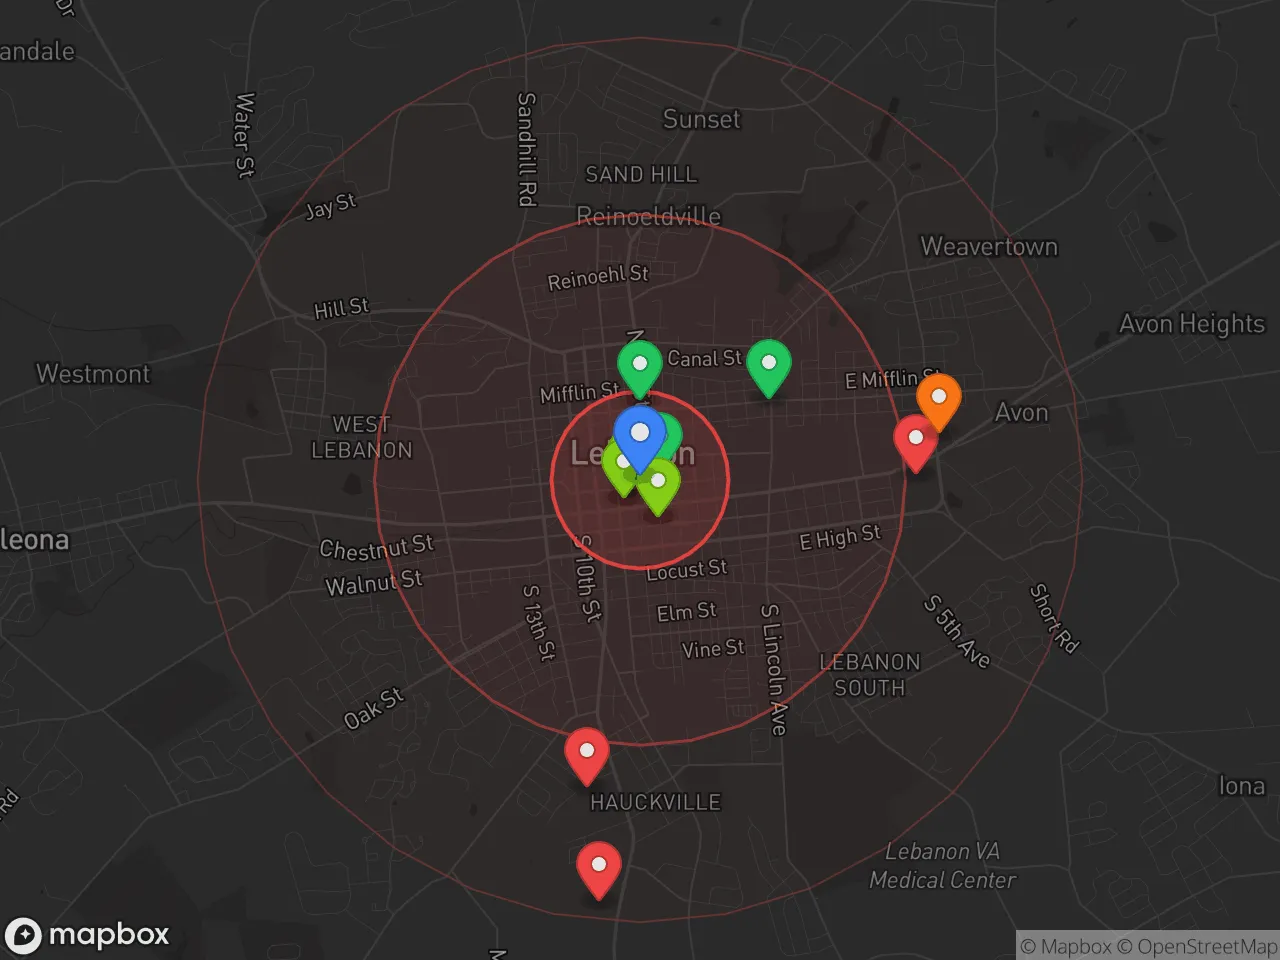
Neighborhood-level variation
Safety in Lebanon is not uniform. The historic downtown and areas near the Lebanon VA Medical Center tend to see more foot traffic and police presence, which can deter some property crime. In contrast, quieter residential streets on the city’s north and east sides, particularly those with vacant properties or lower population density, report higher rates of theft and vandalism. Neighborhoods closer to the city limits, bordering more suburban townships like North Lebanon, often experience fewer incidents. Prospective residents should prioritize blocks with active neighborhood watch programs and well-maintained homes, as visible neglect can attract criminal activity. A thorough review of local crime maps and a direct conversation with the Lebanon Police Department are strongly recommended before committing to a specific address.
* Values derived from national, state, county, city and local statistics and may differ in a specific area. Last updated: 2026-05-01T09:23:47.000Z
Narrative content on this page is AI-generated and may contain mistakes. Verify any details that matter before acting on them.
ReloMaps may earn a commission from affiliate links at no extra cost to you.